Canada is witnessing more thunderstorm impacts than ever before

Gregory Kopp, Western University; David Sills, Western University, and Julian Brimelow, Western University

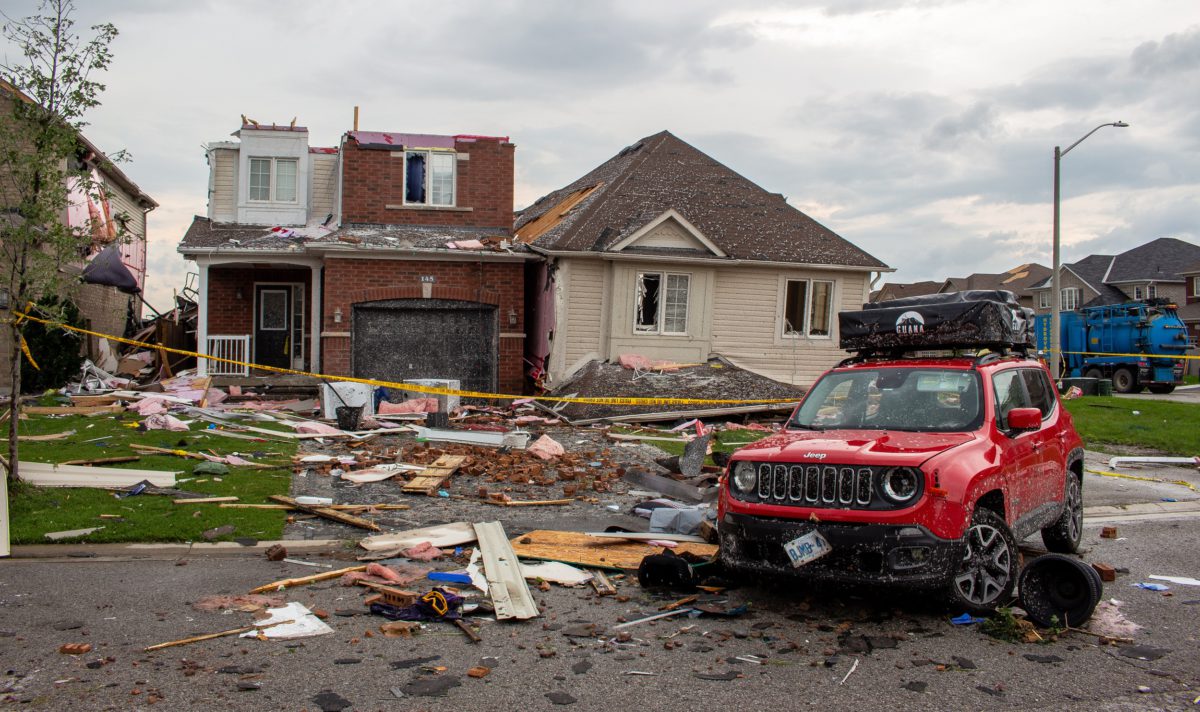
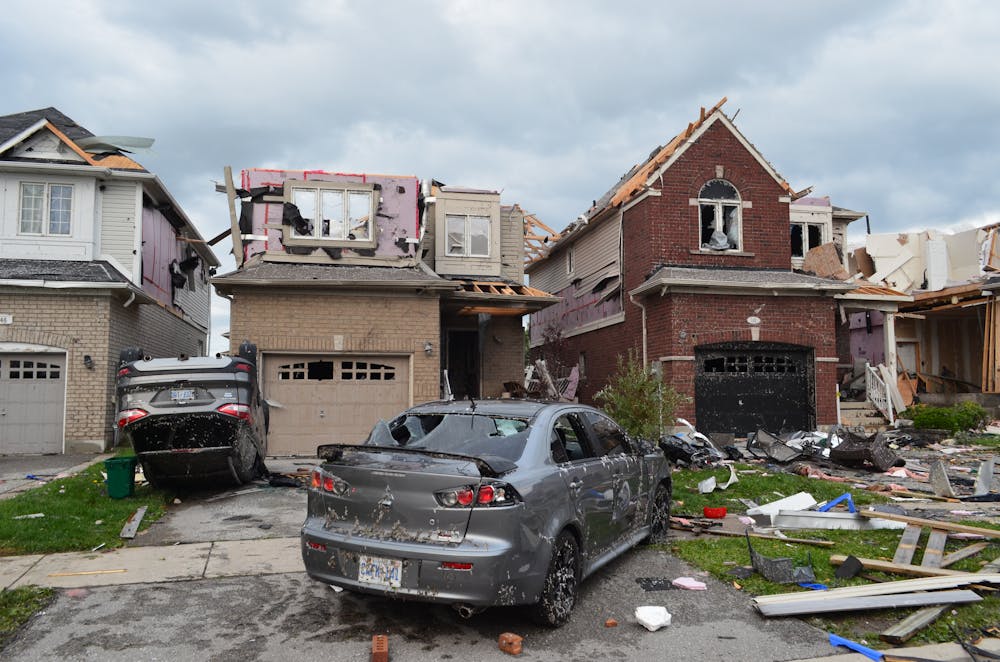
Residents in eastern Ontario are still recovering after a tornado-producing thunderstorm left a path of destruction over 55 kilometres long and up to 1,400 metres wide in July.

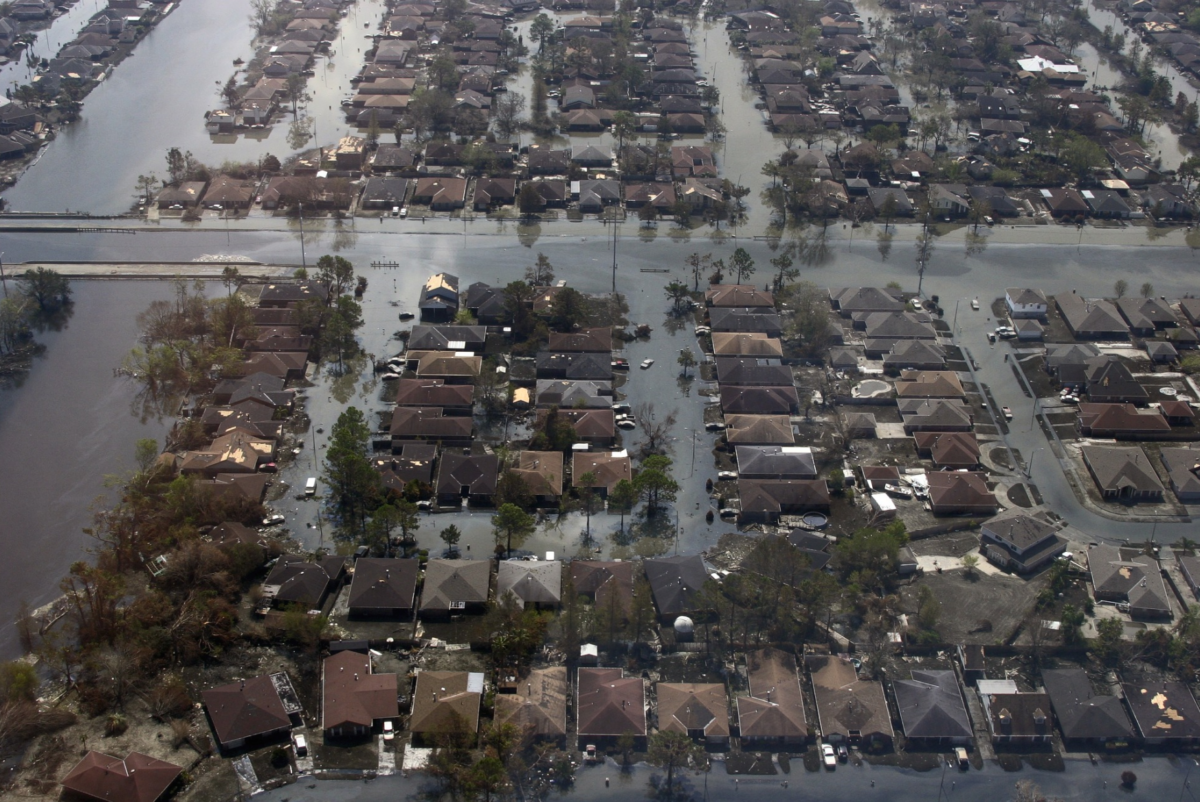
Such thunderstorms, and the damage they leave behind, can have deep and far-reaching impacts on society and the economy, and they are only increasing.

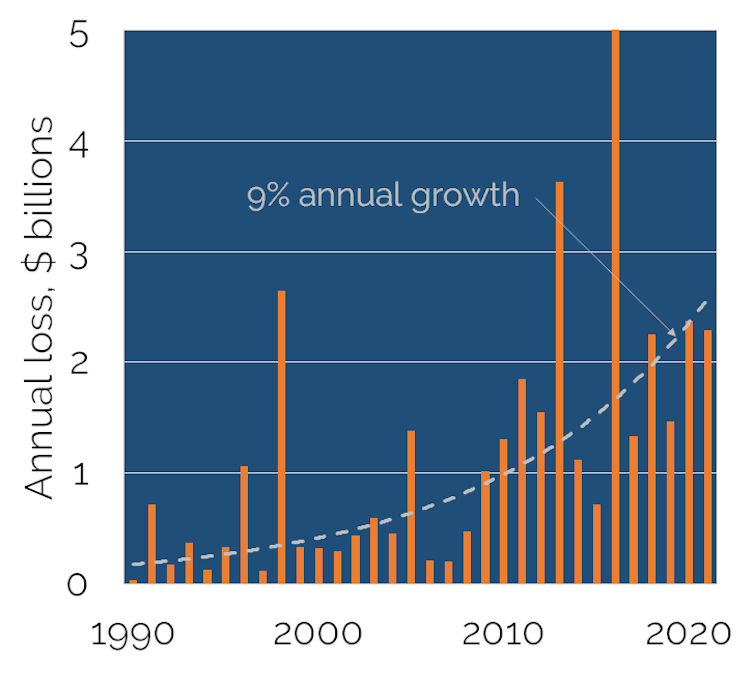
In Canada, the new normal for yearly insured catastrophic losses has reached $2 billion — a significant increase from the $422 million per year between 1983 and 2008 — and a significant chunk of that is from thunderstorm-related severe and extreme weather.

We at the Northern Tornadoes Project and the recently launched offshoot — The Northern Hail Project — are often asked whether these severe and extreme weather events are on the rise, and if this has anything to do with manmade climate change? The simple answer is: it’s complicated.

The difference between severe and extreme

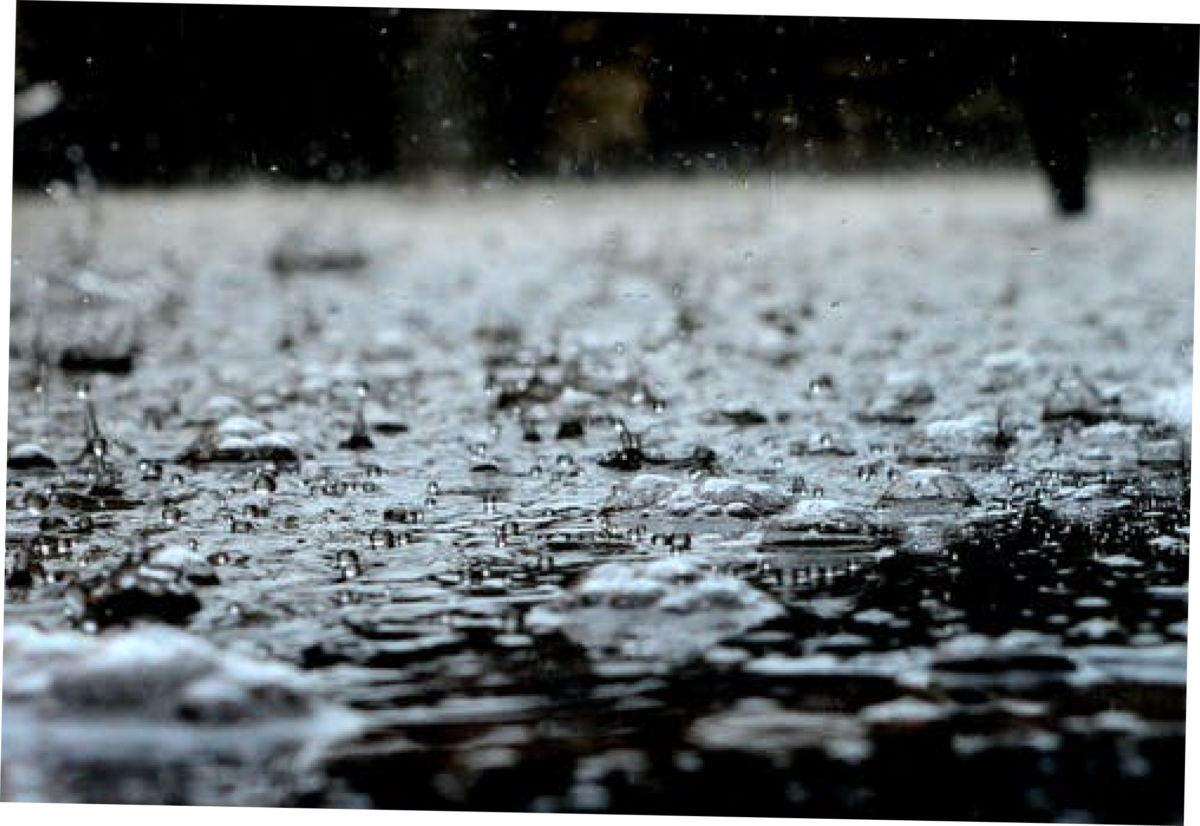
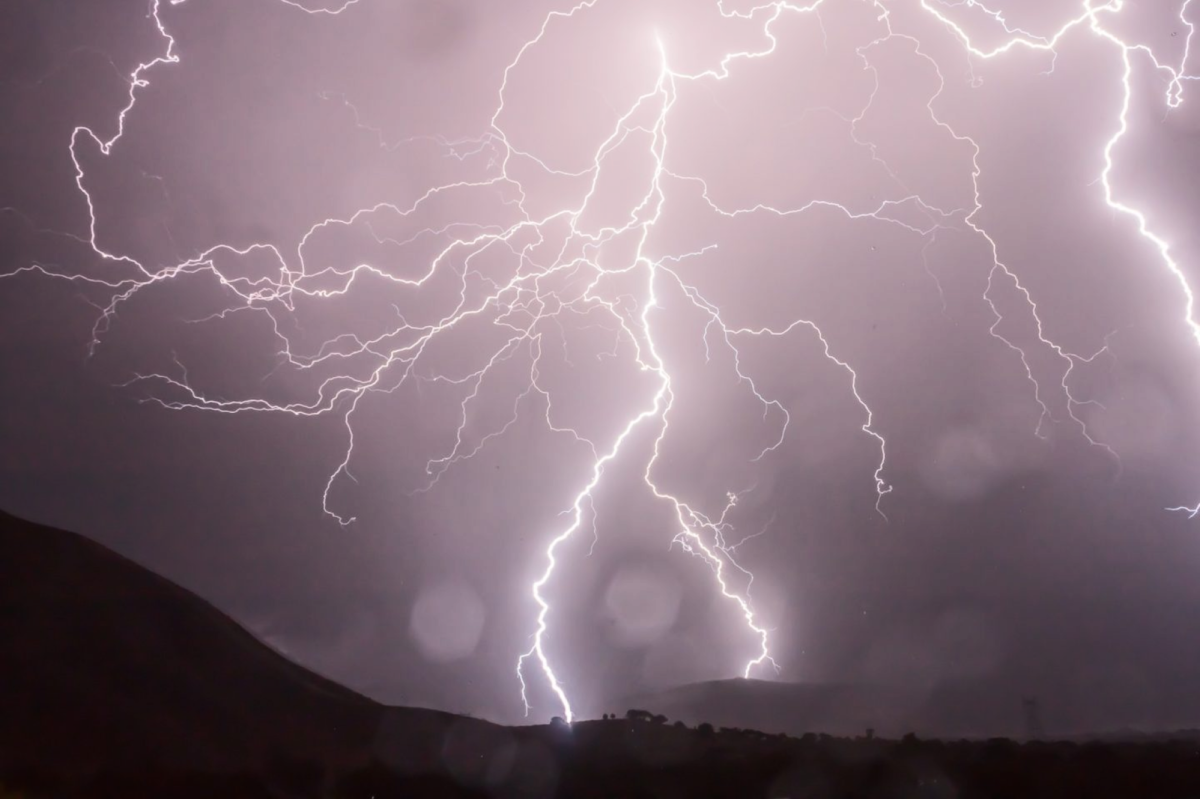
Severe thunderstorms occur in Canada every year, bringing with them large hail, damaging downburst winds, intense rainfall and tornadoes. More rare and of even greater concern are extreme weather events — with their size, intensity or even time of year well beyond what is typically expected based on past observations.

Long, thin tornado from thunderstorm base to ground
Prairie tornado in D’Arcy, Sask. on June 15, 2021. (David Sills), Author provided

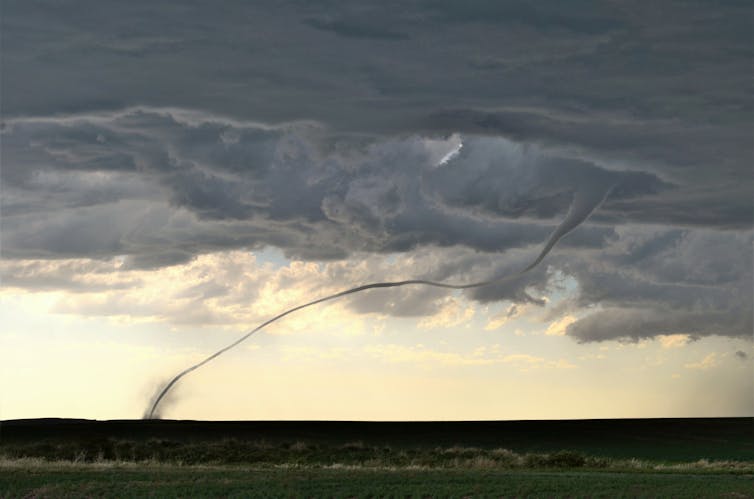
Extreme weather conditions include tornadoes causing damage rated EF3-EF5 and significant hail of over five centimetres in diameter. Extreme weather can also arise when large hail accompanies downburst winds — increasing the hailstone impact energy — or when a long-lived thunderstorm system results in a derecho, which is a cluster of downbursts (and sometimes embedded tornadoes) resulting in intense damage over hundreds of kilometres.

In September 2018, for example, a tornado outbreak in the National Capital Region caused catastrophic damage resulting in over $300 million in insured losses. It is also the latest in the year that a tornado outbreak with up to EF3 damage has been recorded in Canada.

In June 2020, Calgary experienced Canada’s first billion-dollar hailstorm and fourth costliest natural disaster on record, with insured losses of $1.3 billion. The derecho in May 2022 that mainly affected southern Ontario took 12 lives, with early estimates of insured losses close to $900 million. And that’s just over the last four years.

How can we detect these trends?

Such events and their impacts cannot be adequately assessed and documented using standard operational weather observation platforms such as radar and surface weather stations.

Tornado tracks and hailswaths are inherently narrow and often pass between stations. Radar can capture some of the key meteorology, but not the impacts on the ground.

Comprehensive storm surveys by weather and engineering experts are required to fully assess and document the meteorology and its physical impacts through what we call an “event-based approach”. In fact, we recently added a social science component to such investigations to better capture the impacts on people and communities. The living database that results from these storm surveys can always be updated as new information is discovered.

Map depicting a 2017 tornado outbreak in Québec
A map shows the starting locations and tracks of the 23 tornadoes that occurred during a two-day tornado outbreak in Québec in June 2017. (Lesley Elliott and Liz Sutherland/The Northern Tornadoes Project), Author provided

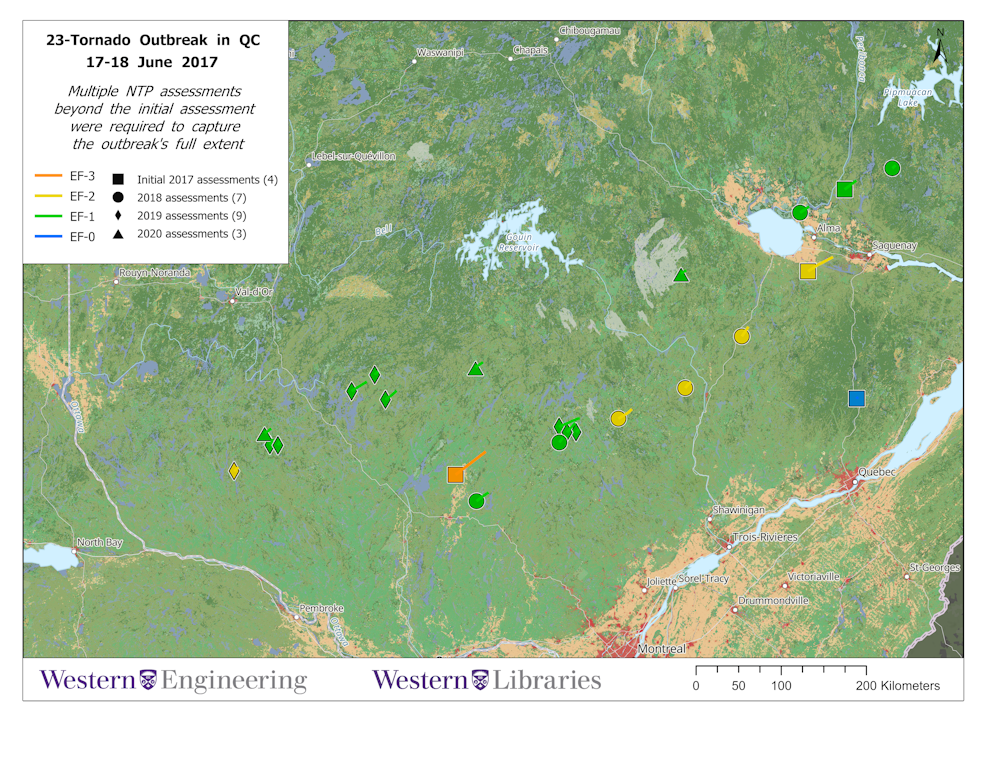
This approach allowed the Northern Tornadoes Project to uncover one of the largest recorded tornado outbreaks in Canadian history — 23 tornadoes over two days in Québec — and increase the number of tornadoes documented across Canada each year. It has also allowed the new Northern Hail Project to recover and document Canada’s largest hailstone on Aug. 1, 2022.

The greater the length and better the quality of a national database of these events, the more likely it is that any severe and extreme storm trends will be detected.

Some progress has been made

The tornado data for Southern Ontario is of sufficient length and quality to allow us to begin to look for trends. A 2022 study found that the annual number of tornadoes recorded there since 1875 has grown substantially. But that is mainly due to an increase in weak tornadoes — ones that might have gone unreported in the past but now fail to escape the attention of the expanding population with consumer-grade cameras at the ready and access to social media for sharing.

The same study found, however, that tornadoes rated F/EF2+ in southern Ontario occurred gradually later in the year since 1875, now peaking in late summer rather than early summer.

Meanwhile, in the U.S., studies have shown that tornadoes may be occurring in bigger clusters and starting to shift eastward – away from the Great Plains and into more populated areas.

In all cases, clear connections to man-made climate change have not yet been established. It is also yet unknown whether extreme storms are changing in ways that are different from severe storms. But it’s still early and research in this area is growing rapidly.

While storm trends are studied, prepare for increased impacts

Canadians are recording and sharing images and experiences of severe and extreme storms more than ever before, increasing the documentation of these events. As the population continues to grow and spread out, the damage and losses caused by thunderstorms will continue to grow.

Damaged cars are seen next to the remains of houses damaged by a tornado.
Damage from an EF2 tornado in Barrie, Ont. on July 15, 2021. (Northern Tornadoes Project), Author provided

At the same time, we are learning more about changing storm patterns and possible connections to climate change. Continuing to increase the length and quality of our national severe and extreme storm event database is needed to better understand such changes.

In the meantime, developing adaptation strategies to ensure resiliency and to lessen the impact of inevitable damaging storms is becoming increasingly important. Improving upon building codes and other policies to promote more resilient buildings and communities is urgently needed to better protect the lives and property of Canadians.

Gregory Kopp, Professor of Civil Engineering & ImpactWX Chair of Severe Storms Engineering, Western University; David Sills, Executive Director – Northern Tornadoes Project, Western University, and Julian Brimelow, Executive Director Northern Hail Project, Western University

This article is republished from The Conversation under a Creative Commons license. Read the original article.

The cheaper we build our buildings, the more they cost after an earthquake, wildfire or tornado

Keith Porter, Western University

A tornado cut a 270-kilometre path through Kentucky in mid-December 2021, killing 80 people, many in their homes or workplaces, and rendering thousands homeless. The incident prompted David Prevatt, a professor of structural engineering at the University of Florida, to write an opinion piece for the Washington Post, reminding Americans that new buildings could be tornado proof, but are not.

We are learning similar truths in Canada. Barrie, Ont., struck by a set of tornadoes on July 15, 2021, is still recovering. So too, are those who survived the fires in Fort McMurray, Alta., in 2016, and in Lytton, B.C., in June 2021. It’s the same story following the floods in British Columbia in November 2021 and the derecho that struck Southwestern Ontario in late May, lifting roofs off some buildings and destroying others.

Engineers, architects and builders can design and construct affordable new buildings that can resist tornadoes, floods and wildfires without making the buildings into bunkers. We could also design earthquake-resilient buildings, but do not.

I am a structural engineer and an expert in performance-based engineering and catastrophe risk management. I believe the only way to make that happen is to require our building code to minimize society’s total cost to own new buildings. We have always been free to make that happen, but have a rare window now to shape that future, as the nation and code developers urgently respond to the climate crisis.

Why don’t we build resilient buildings?

Building-code writers, engineers and others frequently tout the benefits of modern building codes. But new buildings only keep us relatively safe; they’re not disaster proof. Why don’t we build better buildings? Because it would cost a little more.

We build to minimize initial construction costs while maintaining a reasonable degree of safety and avoiding damage where practical, a strategy known as “least-first-cost” construction. We save a small amount on initial construction costs and call the savings “affordability.”

But that kind of affordability is an illusion, like a tantalizingly low sticker price on a flimsy car. Wise car buyers know that the low cost is just the beginning of a series of bills.

In new construction, every dollar saved weaves in $4 or more of future costs to pay for unpredictable catastrophes: severe storms, massive earthquakes and catastrophic wildfires. That future cost is not an if, but a when — or rather a sequence of whens made more frequent and severe by the climate crisis.

In research for the U.S. Federal Emergency Management Agency and others, my colleagues and I applied simple methods to design buildings to be stronger, stiffer, or above the flood plain than the U.S. building code currently requires. (Canada’s National Building Code is similar.) We found that society would initially pay about one per cent more for new construction, but avoid future losses many times greater, minimising society’s long-term ownership cost.

Engineers could have used these ideas long ago. If we had, Canada wouldn’t be losing over $2 billion annually to natural catastrophes, equivalent to the cost of four days of new construction.

Our losses grow nine per cent every year, like a credit card that gets charged more each month than is repaid. But unlike a credit card bill, nature demands an unpredictable, enormous payment any time it wants, from anywhere in the country. No Canadian community is immune.

Graphic showing the rate of increase of disaster losses compared to population growth.
Canada’s annual disaster losses have grown about nine per cent annually, 10 times faster than population growth. Author provided

We can fix the problem

Prime Minister Trudeau has committed to bold, fast action on climate change and its associated disasters, and better building codes can be a part of it. We could install sewer backflow valves in homes and workplaces, use non-combustible siding rather than vinyl in the wildland-urban interface (where the built environment mingles with nature) and install impact-resistant asphalt shingle roofs in hail country. Engineers have long lists of ready-made solutions both for new buildings and the ones we already have.

Building codes created those problems. They aim for safe and maximally affordable construction, and ignore long-term ownership cost. We build cheaply but not efficiently.

Three fatal tornadoes in 15 years convinced city officials in Moore, Okla., that the national building codes weren’t protecting them. So, they enacted an ordinance to make new buildings resistant to all but the most severe tornadoes.

Developers warned that the stricter requirements would drive up home prices and that development would dry up or move outside Moore. Neither thing happened. A few years after the ordinance passed, researchers found no impacts on home prices or development.

Other jurisdictions could do better too, just like Florida did after Hurricane Andrew in 1992. The state leapt ahead of U.S. building codes with its own stricter, more cost-effective code. The Insurance Institute for Business and Home Safety developed a voluntary standard, called “Fortified,” that reduces future losses and more than pays for itself in higher resale value.

Disaster-resilient buildings that also cost less

The climate crisis is forcing major energy-efficiency changes to the building code, offering a rare opportunity to fix our growing disaster liability and minimize long-term ownership cost. The update might include these three steps:

  • Enact a building code objective to minimize society’s total ownership cost of new buildings. The Canadian Commission on Building and Fire Codes could formalize the principle in the National Building Code of Canada.
  • Require code-change requests (proposals people make to the Canadian Commission on Building and Fire Codes for inclusion in the National Building Code) to be accompanied by estimates of added construction costs and benefits in terms of reduced energy use, future repair costs, improved health and life safety outcomes, and other economic effects whose monetary value can be reasonably estimated.
  • Limit the freedom of code committees to reject cost-effective code-change requests.

Such changes will eventually shrink Canada’s disaster credit card balance. While Canada rethinks energy efficiency, it can also tackle the false economy of least-first-cost construction. With slightly greater initial costs, our buildings will be better able to survive disasters and cost less to own in the long run.

With a wiser code, we can have better, safer, more efficient buildings for ourselves, our neighbours, our children and all future Canadians.

Keith Porter, Adjunct research professor, civil and environmental engineering, Western University

This article is republished from The Conversation under a Creative Commons license. Read the original article.

What is a climate stress test? A sustainable finance expert explains

Imagine this: You take out a mortgage to purchase your dream home. But the rate you were quoted has expired, and when you go to renew it you find there’s been a major hike in interest rates. With this new rate, you are no longer able to afford your monthly payments.

How do you avoid this nightmare situation? The answer is a stress test.

In the simplest terms, a stress test helps individuals and institutions mitigate risk and make better decisions by playing out big economic shocks — like a major jump in interest rates or a global pandemic — to ensure they have what it takes to weather the storm.

A stress test is a “what if” exercise, where we contemplate scenarios that would pose the most harm to our financial systems and well-being in order to determine how we can best manage through them. They’re now being increasingly applied to future climate change and the financial risks that come with it.

Physical risks, transition risks

The 2008 financial crisis put the need for better risk planning into sharp relief, especially for financial institutions. It’s no coincidence that we have seen a steady rise in the use of this tool since that time.

Today, financial regulators, banks and policy-makers use stress tests to uncover weak points in how financial institutions operate and identify changes that will help buffer them (and our larger financial system and everyone who depends on it) from harm.

A chart showing the top 10 risks to the world in the next decade
Climate action failure, extreme weather events and biodiversity loss, are the top three global risks over the next 10 years, according to the World Economic Forum’s Global Risks Perception Survey. (World Economic Forum Global Risks Report 2022)

So, what’s a climate stress test? It is the same what-if exercise, conducted through the lens of different climate scenarios that have diverse and significant financial consequences.

On the one hand, there are physical climate risks. Think, for example, of extreme weather events, such as floods, droughts, ice storms or heat waves, that can damage property, disrupt supply chains, increase insurance costs, and shut-down operations. In scenarios where global temperatures rise higher, the physical risks increase.

On the other hand, there are also transition risks. This refers to the material impacts of various degrees of climate ambition and action.

For example, new or more stringent government policies aimed to further reduce carbon emissions or at a faster pace will have different financial impacts on different companies, depending upon their climate-readiness, and on different sectors.

Scenarios aren’t predictions

Climate scenarios take both types of risk into consideration, physical and transition. Like other types of stress tests, these scenarios aren’t predictions. Imagining what would happen if interest rates skyrocket isn’t the same as predicting that they will.

However, given the established scientific consensus that climate change risks are increasing and the high degree of uncertainty these risks create, climate stress tests are an important tool to assess the sustainability of companies, investments and our financial system overall. And there is increasing momentum behind this practice.

For example, the Office of the Superintendent of Financial Institutions (OSFI) and the Bank of Canada recently released a major report examining four climate scenarios over a 30-year horizon, from 2020 to 2050, that varied in terms of ambition, timing of global climate, and pace of global change:

  • Baseline scenario: A scenario with global climate policies in place at the end of 2019.
  • Below 2 C immediate: An immediate policy action toward limiting average global warming to below 2 C.
  • Below 2 C delayed: a delayed policy action toward limiting average global warming to below 2 C.
  • Net-zero 2050 (1.5 C): a more ambitious immediate policy action scenario to limit average global warming to 1.5 C that includes current net-zero commitments by some countries.

Physical risks dominate

The results of the analyses were clear.

First, delayed action will lead to higher economic shocks and risks to financial stability. The longer we wait to act, the more drastic and sudden those actions will be.

Second, while every sector will need to contribute to the transition, the analysis showed that “significant negative financial impacts emerged for some sectors (e.g., fossil fuels) and benefits emerged for others (e.g., electricity).”

Third, macroeconomic risks are present, particularly for carbon intensive commodity exporting countries like Canada.

The European Central Bank also conducted a climate stress test with similar findings. It determined that climate change represents a systemic risk — especially for portfolios in specific economic sectors and geographical areas. For example, in the mining and agriculture sectors, or in oil-dependent regions like the Gulf States.

It also found physical risks will be more prominent in the long run, compared to transition risks. The physical risks of climate change on real estate in coastal regions or on supply chains is expected to be greater than the effects of changes in carbon pricing or other policies.

These findings have clear implications for companies and investors. Now more than ever the business case for prioritizing and evaluating corporate climate resilience is clear, especially as investors and lenders increasingly incorporate climate data into their financial decisions.

For example, it is now more broadly understood how climate policy changes could abruptly impact a company’s valuation and financial outlook. This makes climate policy foresight critical, for corporate leaders and investors alike.

As climate stress tests become increasingly common, their findings and implications will reverberate across the entire financial industry. Savvy leaders will both watch this conversation closely, and take the necessary steps to adapt and thrive.

Ryan Riordan, Professor & Distinguished Professor of Finance, Research Director at the Institute for Sustainable Finance, Queen’s University, Ontario

This article is republished from The Conversation under a Creative Commons license. Read the original article.

The COVID-19 pandemic has revealed that global supply chains are a huge house of cards

Glenn McGillivray, Western University

COVID-19 has laid bare many uncomfortable truths regarding society’s overall preparedness for low-probability but high-impact events, especially global ones. These range from issues pertaining exclusively to pandemic readiness (like our domestic capacity to produce personal protective equipment, ventilators, sanitizer and vaccines) to matters that are considerably less esoteric, like the ability of global supply chains to operate regardless of the various stresses put upon them.

The latter goes far beyond the toilet paper supply issue experienced early in the pandemic. It expands to include a whole range of products like lumber and other building materials, tools, foodstuffs, seeds, furniture, cleaning supplies, aluminum cans, jars, pools and pool equipment, chemicals, bicycles, camping gear, household appliances and replacement parts of all kinds.

In many cases supply chains have been simultaneously squeezed on both ends — supply and demand.

Production and distribution disruptions

While unscheduled closures of manufacturing and distribution facilities, bottlenecks at borders and sick workers have caused choke points in supply lines, people being cooped up in their homes for months on end have driven up demand for a host of products.

There has also been a simultaneous shortage of labour, particularly in the licensed trades.

Throw in other disruptors, like the massive winter storm in Texas in February, the six-day blockage of the Suez Canal due to the grounded ship Ever Given in March and the six-day closure of the Colonial gasoline pipeline in the United States after a cyberattack in early May.

Also include the fact that shipping containers are being lost in record amounts for various reasons, with more than 3,000 going overboard in 2020 and the 2021 number already hitting 1,000 by the end of April.

The pandemic has shown us that global supply chains are a huge house of cards: fragile enough on a good day, but prone to come tumbling down when there’s an unexpected breeze.

This has been particularly apparent with the manufacturing of computer chips.

The demand for microchips

Prior to COVID-19, there was already great pressure on the production of microprocessors, microcontrollers, motherboards and the like due to limited global production capacity and greater calls for product. The pandemic has placed additional pressure on an already pressed segment, as production and distribution bottlenecks have been met with increased pandemic-driven demand.

Not so long ago, disruptions in the production of microchips tended to impact only the manufacture of smart phones, tablets, computers, external hard drives and, more recently, flat screen televisions.

Today, however, such disruptions also impact the production of automobiles, as chips are increasingly being used in power steering and braking systems, car infotainment systems and other components. Indeed, both General Motors and Ford Motor Company have idled a number of plants in North America due to the global semiconductor shortage. And being relative newcomers to the microprocessor market, automakers don’t have the clout that other buyers have, often leaving them out in the cold when supplies dry up.

The situation for automakers is only expected to get worse as more and more consumer goods get smart via wifi or Bluetooth connectivity.

The growing list of items that require microchips is disconcerting, as these components are almost solely manufactured in some of the riskiest places in the world from a natural disaster perspective: China, Japan, Taiwan, South Korea, Malaysia, Thailand, the Philippines and California.

This has to change. We need more manufacturing facilities for microchips and these must be located in places with low risk to natural and other hazards.

Securing supply chains

But whether we are talking about microchips, wood chips or potato chips, corporations need to get intimately familiar with their supply chains if they aren’t already: What they get, how often, in what quantities, from whom, from where, how and why. Business continuity, contingency plans and workarounds must be put in place ahead of time to deal with what-if scenarios. Risk managers — either in-house or third-party consultants — need to be in on these discussions, as do boards of directors.

Corporate insurance buyers and risk managers must understand the differences in key insurance coverages, like standard business interruption and contingent business interruption, and ensure that they have proper financial protection in place.

Finally, and from a big picture perspective, society needs to get a better idea of where choke points exist (both at the manufacturing and distribution levels and in the physical world) so these can be addressed, eased or even eradicated. Further, we need to do more research into understanding how consumers behave in the face of crises. The emerging fields of behavourial economics and decision science have much to contribute to this discussion.

It’s a different world out there, a more interconnected, and a more dangerous one. And we are currently learning the hard way that global supply chains don’t operate on auto pilot.The Conversation

Glenn McGillivray, Managing Director, Institute for Catastrophic Loss Reduction, Western University

This article is republished from The Conversation under a Creative Commons license. Read the original article.

Hurricane straps keep roofs on houses and can improve safety during tornadoes

Gregory Kopp, Western University

Many people think of a well-built house as one where the walls are strong enough to hold up the roof so it won’t fall on them. This is reinforced by children’s stories like the Three Little Pigs, where the house made of brick is the strongest when the Big Bad Wolf comes to town.

When a strong tornado passes through a neighbourhood, it results in total chaos. Debris is everywhere. Shingles and siding and bricks are thrown about. Entire roofs are tossed, often landing on neighbouring homes. Walls collapse, cars are rolled and flipped. Insulation is stuck to every surface like a strange snowfall.

On July 15, a tornado struck Barrie, Ont., destroying several homes: Could anything have been done to minimize the damage in Barrie?

Holding on to the roof

In any windstorm, tornadoes included, the roof needs to be secured — this is due to the uplift, the same physics that allows an aircraft to fly. This runs counter to our intuition since we tend to think about roofs collapsing, not flying. The uplift is the main vulnerability of houses. The structure of residential roofs in Canada tend to be strong because they are designed to handle the heavy weight of snow in winter.

For the wind, which acts in the opposite direction as the snow, it is the nails connecting the trusses to the top of the wall that become critical to ensure that the roof stays in place during a severe storm.

The National Building Code of Canada requires three nails — just over three inches long — in each roof-to-wall connection. These toe nails, as they are called, are what hold the roof down in the wind. If this is done properly, the roof structure should be safe until wind speeds reach about 160 kilometres an hour. At such wind speeds, asphalt shingles may blow off but the roof structure will remain intact.

Houses are not designed for tornadoes, although the building code discusses tornadoes. The requirements for fastening the walls to the foundations were developed to deal with tornadoes. These were included in the 1995 release of the National Building Code following tragic deaths in 1984 when cottages were swept into Blue Sea Lake in Québec, along with post-storm observations following a 1985 tornado in Barrie.

It is now known that toe-nailed connections are the weak links in the structure, more likely to fail before the roof sheathing and before the walls pull apart from the foundation. Walls are more likely to collapse when the roof is gone, and the roof itself can become airborne. Both of these are threats to life and safety.

The Northern Tornadoes Project survey in the immediate aftermath of the recent tornado in Barrie indicated that several homes did not meet the building code requirements because of missing toe nails.

This is nothing new.

Similar observations were made in 2009, when tornadoes landed in Vaughan, and in 2014 in Angus.

Unknown speeds

To design for tornadoes, we need to know the wind speeds in tornadoes. These are rarely measured. Rather, tornado wind speeds are assessed through the damage they cause, via the Enhanced Fujita Scale.

The recent Barrie tornado was assessed to have had maximum wind speeds of 210 kilometres an hour based on the damage to a few of the houses. It was a strong tornado. However, if this strong tornado had instead gone through farmers’ fields, missing all buildings and trees, then it would have been assessed as an EF-0 (90-130 km/hr) tornado even though its true strength was greater. Clearly, the use of damage to estimate the tornado wind speeds is challenging, particularly in sparsely populated areas.

As a result, the reported intensity of a tornado — its maximum wind speed — depends on what it hits and, therefore, on the quality of construction. A roof with only a single toe nail would be assessed as EF-1, while properly installed toe nails yield an expected wind speed of about 195 kilometres an hour, which is EF-2.

Put another way, a wood-frame roof is expected to fail in an EF-2 tornado, while improper toe nails would lead to roof failure in an EF-1 tornado. As a result of this uncertainty, quantifying wind speeds in tornadoes is still an active topic of research and development.

Nevertheless, the combination of tornado simulators, wind tunnels that create tornado vortices to define the wind forces on buildings, and full-scale laboratory tests on houses to determine their strength has helped. They’ve provided good estimates of failure-inducing wind speeds during tornadoes under a range of conditions including that of the roof-to-wall connections.

Could anything have been done to mitigate the damage in this EF-2 tornado? In any tornado, the highest wind speeds only occur over a relatively small proportion of the total damage path. That means damage reduction measures can be quite effective in mitigating damage from the overall storm.

If all of the houses in Barrie had been built to the building code requirements, there would have been less damage overall, although there still would have been some significant damage because of its intensity.

Strapping down

There is a better solution: the use of hurricane straps instead of toe nails. This well-established technology, developed to deal with hurricanes, can work to keep the roof attached to the walls in tornadoes with wind speeds up to about EF-2. They are inexpensive, costing less than $200 per house to install, and are easy to inspect for compliance.

Hurricane straps are a more efficient and safer replacement.

Since EF-2 and lower-rated tornadoes represent more than 95 per cent of all tornadoes, requiring straps in the building code could reduce much of the damage of these severe storms and and significantly improve safety.

While a few other things need to be done to make houses fully able to withstand EF-2 tornadoes, this adjustment would eliminate the weakest link, increasing resilience and safety by keeping the roof on the walls and stopping entire roofs from flying downwind and hitting other buildings.The Conversation

Gregory Kopp, Professor of Civil Engineering & ImpactWX Chair of Severe Storms Engineering, Western University

Thumbnail: Some of the worst damage from the EF-2 tornado that struck the Ontario city of Barrie on July 15.(Northern Tornadoes Project) Author provided

This article is republished from The Conversation under a Creative Commons license. Read the original article.

We can’t predict the next wildfire disaster – but we can plan for it

Jen Beverly, University of Alberta

Intense, fast-spreading fires are an enduring and natural feature of Canadian landscapes, but for most of the past 40 years, relatively few residents were evacuated each year. Yet, in the past 10 years, an unprecedented number of homes have burned in Alberta and British Columbia.

Recently, a wildfire destroyed 90 per cent of Lytton, B.C. Residents had minutes to evacuate as the fire engulfed the village. Slave Lake and Fort McMurray have also suffered enormous losses within the past decade.

As a wildfire scientist, when I look at these disasters I don’t see isolated events, or even a trend, but an abrupt shift to a completely new state. Since 2011, Western Canada has experienced a succession of extreme fire seasons with prolonged threats that affect many communities and last weeks or months.

When I think about what unfolded in Lytton and elsewhere, I am reminded of American business magnate Warren Buffett’s advice on the need to prepare for adversity: “Predicting rain doesn’t count. Building arks does.” For me, this means that efforts to predict fire risk and to prioritize mitigation efforts are not enough. Now is the time to prepare for fire disasters — wherever they are possible — and to start deciding what we will do when they happen.

Evacuations were infrequent, untracked

Twenty years ago, there were no national statistics on wildfire evacuations. The 2003 Okanagan Mountain Park Fire that consumed 239 homes in Kelowna, B.C. first exposed how little we knew about the problem. Was it an isolated anomaly or a harbinger of what was to come?

In the years that followed, my colleagues and I began to compile details from newspaper archives and records from emergency response agencies gathered from 1980 to 2007. Overall, evacuations had displaced a relatively small number of Canadians. In more than 25 years, wildfires destroyed 497 homes and prompted evacuation of just 210,000 people, the equivalent of about 18 homes and 7,500 evacuees annually. We confirmed only one civilian fatality.

That compares with roughly 3,000 homes lost in Slave Lake in 2011 and Fort McMurray in 2016. Fort McMurray also had 80,000 evacuees in 2016 and B.C. had 65,000 evacuees the following year. In Alberta, 15,000 were evacuated during the spring of 2019 alone.

Analysis of national fire numbers and area burned have revealed statistically significant increasing trends in large parts of Western Canada. Nationally, the largest fires have doubled in size since 1959. We also know that fire seasons are getting longer, with a larger number of days being conducive to the types of fast-spreading, intense fires that can threaten public safety and property.

In recent decades, there has been a surge of research studies that seek to predict how fire regimes — fire frequency, size, intensity, severity and season — can be expected to change in concert with our heating climate. Those studies certainly point to intensification of the kinds of weather extremes that produce wildfire disasters like the recent one in Lytton.

Possible catastrophes need action

Prediction has long been a cornerstone of fire research and fire management. We study the data and build complex models to identify which areas are most likely to burn today, tomorrow, this year and in the years to come. This information can help decision makers prioritize limited fire suppression resources and mitigation budgets, such as those allocated for FireSmart fuel reduction treatments.

Early in my career, I used complex computer simulation models to try to map the locations most likely to burn in the next or several years. But when we looked at where the real fires occurred in the years that followed, we discovered that most fires consumed areas assessed as having a relatively low likelihood of burning.

No matter how sophisticated, fire risk assessments are riddled with uncertainties and crippled by the inherent variability and the random nature — referred to as stochasticity — that accompany fires, weather and fuel at play.

Governments can prioritize the most at-risk communities in a region and allocate mitigation funds to the top 20, but the next disaster could very well hit community No. 21. When conditions are extreme, like the 60 km/h winds reported in Lytton, FireSmart fuel reduction treatments cannot be relied upon to protect a community from an encroaching fire.

The evacuation records taught us that these events often unfold under highly atypical conditions such as extreme wind speeds that would be ignored in risk assessments based on what is most likely. In short, if it’s possible for an area to burn at all, then you need to plan for it.

Take what you know and plan what you’ll do

So what do we know for certain? Fuels are the hazard or precondition necessary for fire, and we know where the fuels are. In this context, fuels are live and dead biomass or vegetation. We can map the fuel hazard and identify which locations of a community or landscape is exposed to potential ignitions.

This simple approach led to the creation of the FireSmart Exposure Assessment tool for informing community protection planning, and we’ve recently shown that it works for assessing large landscapes too.

My research team is currently extending that work to map potential fire pathways into communities, and in collaboration with transportation engineer Amy Kim and her students, we’re asking how the flow of fire into a community could disrupt the flow of people evacuating the area.

Our aim is to develop simple and easily computed metrics of fire exposure, fire pathways and evacuation routes to inform what-if scenarios. Agencies and communities can use these to understand vulnerabilities and develop proactive strategies for mitigation, response, containment and evacuation.

Science can inform the planning process, but ultimately these efforts will only succeed when solutions are developed locally to capture local circumstances, knowledge and needs. Rather than a burden, planning for fire can be a mechanism for growing local skills and long lasting community connections, by bringing diverse perspectives together around the common goal of a safer and more resilient future.

When it comes to wildfire threats to communities, we are navigating uncharted waters. Under extreme conditions like those across B.C. this summer, we cannot stop a spreading wildfire. When they occur, the only option is to contain it or evacuate. So start planning your route now. The Conversation

Jen Beverly, Assistant Professor, Wildland Fire, University of Alberta

This article is republished from The Conversation under a Creative Commons license. Read the original article.

Risk Perception Floods the Risk Communication Scene

Here’s something you probably know from experience: your perceived risk of a threat can be very different from the actual risk of that threat. That we would sooner set foot in a car than a body of water home to the occasional shark is a case-in-point of our fundamentally flawed sense of risk perception.

Our faulty risk compasses by themselves aren’t the problem—risk perception is a pretty handy natural defense mechanism. What actually matters is the situations we analyze for risk, and how we respond in turn.

It’s impossible to constantly take stock of the complex risk environment associated with simply existing in the world. We’d only cause ourselves undue stress to fret over risks we can’t control; even experts can’t be expected to be completely prepared for catastrophic events like tsunamis and major oil spills.

To swim or not to swim...
To swim, or not to swim. Photo by Lubo Minar on Unsplash

It’s most pragmatic to concern ourselves with low-impact, high probability threats. These mundane threats are often eclipsed, however, by their high- impact, low probability counterparts. Think about the everyday wear-and-tear of exercise on your body—there’s a high probability of soreness or pulling a muscle, but the threat to our life is low. Still, the threat of a shark attack is more exciting to our brains than the risk of pulling a hamstring. Our risk compasses have a tendency to confuse north with south.

Water, Water Everywhere, and Not a Hint of Risk

In Canada, flooding is an example of a persistent, relatively low-level threat that most people don’t typically consider risky enough to merit preparation. In a 2020 survey by the applied flood risk research group Partners for Action, nearly half of the 2,500 Canadian homeowners living in a designated flood zone said that they were unconcerned about flooding, and just over half had not taken action to protect their property from flooding. Subsidized sump pump, anyone?

No matter what our risk perception may tell us, floods are actually the most common natural disaster in Canada. The Canadian Disaster Database reported 91 significant floods in the last two decades, which is close to half the total number of flood events that occurred in Canada in the entirety of the 20th century.

Along with the increased frequency of flooding is the cost to property-owners, insurers, and all levels of government. Flooding is largely to blame for the property and casualty insurance industry’s mounting catastrophic insurable losses each year. Catastrophic losses represent insured losses for a disaster that total $25 million or more, and they’ve risen steadily since the 1980s. In light of the financial burden of ever-more frequent and intense floods—including the devastating Alberta floods of 2013—the Harper government began to usher in an integrated approach to flood management to try to disperse the risks (and costs) among everyone involved in flood management. Historically, the onus of flood management rested almost exclusively on federal governments, who relied on physical control measures (think, dikes and dams) to manage floods. The new, risk-based approach relies less on structures and more on collaboration.

This means that federal disaster aid programmes have been winding down, and at the same time, the availability of private flood insurance and property-level flood protection measures, like residential flood risk assessment training courses and free how-to guides, have increased. Canadian homeowners and renters have become responsible for their own home flood protection and flood response in an unprecedented way.

Thinking about risk
A chronic hazard for many Canadians. Photo by billow926 on Unsplash

Flooding is a chronic hazard that many Canadian homeowners and renters pay for dearly—financially, physically, and emotionally—but residents aren’t acting on reducing their personal flood risk. It’s tempting to say that the solution to galvanizing action among the public is to spread information about flood risk widely, and then, armed with this knowledge, people might adopt risk-averse behaviours.

But maybe that’s naïve. To the exasperation of emergency managers and public officials everywhere, people can be told about all the dangers of a risk and still neglect to change their behaviour. It turns out that flood risk awareness is just one of the catalysts for acting on the very real risk flooding presents. Knowledge, access to resources, and risk perception all play a role in determining our flood-related actions (or lack thereof).

What Lies Between Perception and Action?

Risk perception is undoubtedly the most nebulous piece of the risk judgement-to-action puzzle.  Even though we know a bit about what determines flood risk perception—income, gender, age, and previous flood experience, to name a few—the problem lies in the gap between how people perceive their own personal flood risk, and the actual risk of flooding in their area. Closing the risk perception gap is difficult because, well, people are irrational.

According to psychology and behavioural economics professor Dr. Dan Ariely, humans are unequivocally irrational. Nevertheless, there is method to our madness.

“Why do we splurge on a lavish meal but cut coupons to save twenty-five cents on a can of soup?” muses Ariely in his 2008 book, Predictably Irrational: The Hidden Forces That Shape Our Decisions. “We consistently overpay, underestimate, and procrastinate. Yet these misguided behaviors are neither random nor senseless. They’re systematic and predictable—making us predictably irrational.”

People’s “predictable irrationality” has long been exploited for commercial purposes by advertisement companies, who are eerily good at preying upon consumers’ unconscious wants and desires. Beyond their commercial uses, our predictable patterns of behaviour can be used to more compassionate ends, such as motivating healthy behaviours through public health messaging.

A common behavioural intervention is reinforcement, which, for health risks, include ‘punishments’ that take the form of graphic warning labels on cigarette packaging to discourage smoking, or being denied entry into a public space without a face mask to reduce the spread of COVID-19. A positive reinforcement might be to ‘nudge’ consumers into healthy behaviours by placing healthy foods at the front of a store and unhealthy ones near the back.

So far, the evidence has shown that the science behind health risk interventions may be key in addressing how people perceive natural hazards, including floods. Protection motivation theory (PMT), a behavioural theory that explains how individuals make decisions about threats, actually has its origins in the field of health science.

More recently, PMT has been shown to accurately account for the risk perception mechanisms—like the role of income in determining flood risk perception and the likelihood of adopting flood risk-averse behaviours—of flood-prone homeowners in France, Germany and the United States.

Flood Risk Communication Awash in Behavioural Science

Theories like PMT help to explain the seemingly inexplicable differences in flood risk perception levels among specific demographic groups—for instance, the higher levels of flood risk perception among female-identifying homeowners and tenants shown in some research.

This is important: identifying gaps in risk perception based on social, economic and spatial factors could help to make flood risk communication to the public more consistent and targeted. In other words, the messaging around flood risk should resonate with the lived reality of the people experiencing the risk, otherwise, who cares?

There’s a compelling case for including risk perception in the design of educational initiatives and awareness campaigns. With advancements in flood risk research, we can adjust our methods of public engagement to promote flood-safe behaviours using the same science that backs tried and true methods to motivate behaviour change.

Imagining a Canadian society with accessible, effective messaging about flood risk looks something like this: flood risk information gracing the walls of public transportation stations everywhere, geo-targeted flood forecasting and warnings on social media, and dedicated home flood protection departments at essential businesses.

The messaging around flood risk should resonate with the lived reality of the people experiencing the risk.
Photo by Berkay Gumustekin on Unsplash

Communication efforts must be taken on by diverse groups of flood risk stakeholders. Academia, insurance companies, community groups, financial institutions and local politicians all have an important opportunity to engage with members of the public about flood risk. Canada is in the midst of a transition in flood management that calls on everyone to do their part. This requires widespread behaviour change by individuals—but first, we need to understand how and why people make decisions. Identifying risk perception strategies for changing behaviour might help do just that.

This article was prepared for CatIQ by Rachel Krueger, School of Environment, Enterprise and Development, University of Waterloo.

Why it matters that British Columbians buy earthquake insurance; Washingtonians don’t

Glenn McGillivray, Western University and Mary Kelly, Wilfrid Laurier University

The Pacific Northwest is a region that is both blessed with staggering natural beauty and cursed with extreme risk from powerful earthquakes.

But even though Canadians and Americans living in the region share virtually the same risk from a major quake, the 49th parallel that demarcates the boundary between Canada and the United States also marks another line — more than 60 per cent of homeowners in the lower mainland of British Columbia purchase earthquake insurance protection for their homes and belongings, while less than 14 per cent of those in western Washington State do the same.

In insurance lingo, this means there is a “protection gap” in both B.C. and in Washington State, though the gap appears to be more of a gaping chasm for Americans.

What is the ‘protection gap?’

As losses from natural hazards are on an upward trajectory, both globally and in Canada, the protection gap has been a popular topic in the insurance industry in recent years.

This gap is defined as the portion of total losses generated by an event like a hurricane, flood or earthquake that is not covered by insurance. Globally in U.S. dollars, this gap came in at $171 billion in 2020 for all natural disasters, as only $97 billion of the total $268 billion in damage was insured.

Over the past decade, only $102 billion of $535 billion in losses were covered by insurance for earthquakes alone.

This is problematic because, essentially, the bigger the gap, the greater the disaster-related costs that are borne out-of-pocket by society. According to research, when more people buy insurance, society tends to be more resilient, prompting it to bounce back faster after a catastrophic loss than in places where fewer people buy purchase coverage.

The risk is there, so why not the coverage?

Several theories exist as to why the number of people who buy earthquake insurance in earthquake-prone countries tends to be low considering the significant risk.

Our team (including Steven Bowen, head of catastrophic insight at Aon, a global professional services firm) looked at several potential influences on the decision to purchase earthquake insurance, including socioeconomic factors (such as age, education, income), perceptions of seismic risk and expectation of government bailouts via disaster assistance programs, as well as issues pertaining to the cost of the product and the unattractiveness of the policy design.

Our work finds very little difference in most of these factors in the U.S. and Canada, so these small differences don’t explain the significant variance in take-up rates in B.C. and Washington.

The only significant difference found between the two locales is the broader availability of government disaster assistance in Washington over B.C. While there are numerous aid and grant programs to help uninsured or under-insured people in the U.S., the B.C. government has publicly stated that it will not pay assistance for earthquake damage because of the availability of private insurance.

We believe this and issues centring around national culture are two main reasons why earthquake insurance take-up rates are so low in Washington.

The Canadian Constitution heralds Canada’s “peace, order and good government” while the U.S. Declaration of Independence emphasizes “life, liberty and the pursuit of happiness.” Because Americans tend to be individualistic and less likely to trust information provided by authorities, they are more likely to underestimate the potential risk.

This has resulted not only in low take-up rates for earthquake insurance in western Washington, but also in California, where roughly only 10 per cent of households have proper coverage.

Narrowing the gap

Given the worldwide increase in economic losses due to natural catastrophes, it’s essential to narrow the insurance protection gap. When losses are insured, people and institutions don’t need to pay for losses out of pocket. Reducing the protection gap reduces the burden on taxpayers and promotes societal resiliency.

While the protection gap exists for many reasons, potential solutions have been explored worldwide to reduce it. For example, mortgage lenders could require, or governments could mandate, the purchase of insurance.

Changes in product design could also motivate more homeowners to purchase earthquake insurance, from bundling all potential disasters into a basic insurance policy to changing policy duration from the typical one year to multiple years and providing “insurance vouchers” to high-risk but low-income households.

There may also be a role for governments to act as insurers, provide a liquidity or solvency backstop to insurers or offer coverage through property taxes.

Our findings go beyond the issue of earthquake risk and are relevant when considering the impact of climate change, because the phenomenon will increase in the face of extreme weather events around the world.

The increased risk will require both insurers and governments to take steps to ensure that adequate protection against catastrophic losses is in place.The Conversation

Glenn McGillivray, Managing Director, Institute for Catastrophic Loss Reduction, Western University and Mary Kelly, Chair in Insurance and Professor, Finance, Wilfrid Laurier University

This article is republished from The Conversation under a Creative Commons license. Read the original article.

The Hurdle of Replacement Cost Value (RCV) to Building Back Better

The Hurdle of Replacement Cost Value (RCV) to Building Back Better

  • Emily Stock, lawyer, Monaghan Reain Lui Taylor LLP

When we discuss the concept of building back better, we all agree that it is great.  Who can oppose making our communities, infrastructure and people more resilient to catastrophes.  We also recognize that there are a multitude of hurdles to consider, and that underlying many of those hurdles is an often inflexible legal regime.

Understanding property insurance coverages is significant to any policy for building back better.  Typically property insurance policies provide for some combination of Actual Cash Value and Replacement Cost Value, depending on a variety of criteria.

Actual Cash Value (ACV) is also sometimes referred to as market value.  It is intended to be the dollar amount you could expect to receive for the item if you sold it in the marketplace.  It thus takes into account depreciation of the property.  An insurance company determines the depreciation based on a combination of objective criteria (a formula considering the category and age) and a subjective assessment in the marketplace.  The result is that if a homeowner receives ACV they technically receive exactly what they lost (i.e. the value of an old house); however they cannot afford to replace their property (i.e. build a new house).

Replacement Cost Value (RCV) is the cost to replace the property.  It insures the depreciation of the property, so that the homeowner receives the cost to build a new house similar to the house they lost.  When we talk about building back better, the homeowner can typically only afford to rebuild if they are able to obtain RCV.

The difficulty in obtaining RCV is that it is typically only available where the rebuild is:

(a)        at the same site or location; and,

(b)        uses materials of “like kind and quality.”

But what if being at the same location, or building the like kind and quality, is not building back better?  Consider if the insured event is a flood in an area that is now prone to flood zones.  We don’t want to encourage that homeowner to rebuild in the same location, despite there being significant financial incentive for them to do so.  Similarly if the event is a fire, we know that we don’t want to require that the rebuild use the same non-fire resistance materials (i.e. siding, roofing materials), or even to rebuild the same type of structure which may have been inappropriate for the location recognizing the changing environment.

Although we recognize that the wording of the policy must define the rights of the homeowner, and the monetary obligation of the insurer, I expect we would also agree that it seems unfair to require the homeowner to rebuild at the same site, or use materials of like kind and quality, where such is contrary to the principles of building back better.

In considering this conundrum, it is helpful to consider the rationale for RCV, as recently articulated by the Ontario Court of Appeal in Carter v. Intact.  After recognizing that replacement cost insurance is justifiable even though it provides the policyholder with greater value than what they lost, the Court explained the following as to why the limitations on RCV are reasonable and required:

… allowing insureds to replace old with new raises a concern for the insurance industry. The concern is moral hazard: the possibility that insureds will intentionally destroy their property in order to profit from their insurance; or the possibility that insureds will be careless about preventing insured losses because they will be better off financially after a loss.

To put a brake on moral hazard, insurers will typically only offer replacement cost coverage if insureds actually repair or replace their damaged or destroyed property. If they do not, they will receive only the actual cash value of their insured property.

It is clear from this reasoning that there is little to no risk of the moral hazard in catastrophic insured events.  There is similarly no risk of the moral hazard where an insured homeowner does not want to comply with one or both of the criteria to receive RCV, same location and/or like kind and quality, because of a desire to build back better.

As an advocate for encouraging the insurance industry to build back better, we therefore advocate thoughtfully reducing the two criteria for building back better.  This could be done proactively by deleting the same location requirement in policies in flood or other risk zones.  The like kind and quality criteria should also be carefully examined for certain types of insured events (i.e. fires), so that more appropriate materials can be agreed upon before the event as acceptable under the policy.

An important step to reducing these types of hurdles is to continue and develop the conversation, which I look forward to doing at the CATIQ Canadian Catastrophe Conference in 2018, and beyond.

IMPROVING WILDFIRE AND FLOOD RISK MITIGATION IN CANADA

Improving Wildfire and Flood Risk Mitigation in Canada

Author: Alan Frith, CPCU, ARe, CEEM

Canadians have suffered an increasing number of natural and man-made disasters that have devastated communities and cost insurers more than CAD 5 billion in 2016 alone. With decentralized regulation and prevention efforts, the growing financial fallout is only likely to worsen. CatIQ’s Canadian Catastrophe Conference, January 31 – February 3, 2018, will bring together industry, academia, and government to discuss Canada’s natural and man-made catastrophes. I will be sitting on a panel discussing the viability of the Alberta property insurance market in light of recent catastrophic events.

For insurers, an accurate and objective view of risk, reinforced by an up-to-date insight into the exposure, is crucial to maintaining financial stability. Managing catastrophe risk through historical losses alone is unreliable and volatile. Organizations must seek out the most comprehensive information available to understand how rapidly changing environmental characteristics alter their risk profiles.

Let’s examine two of the perils that have recently caused significant losses in Canada to understand how risk assessment tools can be used to quantify the impact of these kinds of events.

Wildfire

High-resolution satellite imagery enables us to develop an in-depth understanding of land use/land cover and is a critical piece of the risk mitigation framework. Using this imagery, risk modelers can construct an accurate map of potential fuel sources, a fundamental requirement for effectively modeling wildfire spread. Dense or dry vegetation, for instance, allows a fire to spread easily, while roads, rivers, or even mountains serve as natural firebreaks. Depending on the local distribution of fuel sources, the interaction between different types of fuels, and the gradual evolution of the surrounding landscape, your portfolio’s exposure may very well outpace your organization’s risk appetite over time.

It’s also important to monitor the effect of population movement. Rapid residential and commercial/industrial growth deeper into areas of combustible fuel, the Wildland Urban Interface (WUI),  exposes properties to greater wildfire risk. For organizations underwriting property risk in Canada, one fire in recent memory certainly stands out from the rest, demonstrating well the dangers of increased development in the WUI.

In 2016, the Fort McMurray fire blazed through the surrounding areas of northeastern Alberta, causing unprecedented devastation and destroying up to 80% of homes in some neighborhoods. A hub of oil production in Canada, the town had experienced a 30% population boom between 2006 and 2011 as people moved to the area to take advantage of job opportunities at the many mines and oil sands refineries in the area. The increased presence of residential structures among dense forest helped the flames spread quickly and resulted in insured losses of nearly CAD 4 billion – making it the costliest natural disaster in Canadian history. Although the oil facilities and pipelines themselves avoided damage, oil companies suffered significant business interruption losses as firefighters struggled for months to contain and extinguish the fires.

Flood

Detailed satellite imagery, coupled with high-resolution elevation data in the form of digital terrain maps (DTMs), is also used to build floodplain maps, which play an important role in evaluating flood risk. Reliable model output for this peril is highly dependent on precise exposure locations, as small changes to a location’s elevation or proximity to floodplains can have a significant impact on potential losses. The development of risk mitigation strategies, such as strict building codes and zoning laws, can help prevent these losses, so long as these codes are followed and the laws are enforced. Government agencies must consider the effect that unchecked commercial development—and the associated infrastructure of roads, sidewalks, and parking lots—can have on the larger ecosystem, especially during a natural disaster. The consequences of unregulated urban sprawl were recently seen in Houston, Texas, during Hurricane Harvey: Severe flooding was caused in part by floodwater that had inadequate access to natural drainage, such as undeveloped prairie and marshland areas.

Although flood is by far the most frequent natural disaster in Canada, preventive efforts are largely decentralized. For residential structures, overland flood damage has only recently been included as a covered peril by private insurance. In many cases, it’s a common exclusion from homeowners’ policies, with catastrophic losses ultimately falling in taxpayers’ laps via government emergency funds. With multiple catastrophic flood events in the past seven years, each causing billions of dollars of losses, it’s imperative to mitigate risk through preventive measures. This includes building flood defense systems as well as encouraging homeowners in and around potential flood zones to purchase policies that protect them against flood loss.

What’s Next?

Governments, insurers, and homeowners need to work together to reduce losses caused by natural disasters. It’s encouraging to see mitigation efforts gaining momentum, but there is much more work to be done. While government can manage building codes and zoning laws, it’s also up to insurers to carefully evaluate their risk profiles and exposures to ensure that they continue to maintain adequate reserves in the event of a catastrophe.

A useful first step in risk assessment is a detailed hazard map. These maps indicate the associated risks for perils such as wildfire and inland flood for a range of return periods, such as 100, 250, and 500 years. The logical next step to advance your risk evaluation strategy is to use a probabilistic model.  These models use advanced simulation methods to provide valuable metrics such as Average Annual Loss (AAL), Tail Value at Risk (TVaR) and a full Exceedance Probability (EP) Curve, from portfolio level down to individual exposures.

The Geospatial Analytics Module in AIR’s Touchstone® platform lets you seamlessly integrate exposure information with location-specific hazard maps, including wildfire fuel layers and flood inundation footprints for Canada. In addition, AIR offers probabilistic models for earthquake, crop hail, severe thunderstorm, winter storm, and tropical cyclone in Canada; models for wildfire and flood are being developed. As the insurance industry in Canada continues to cope with recent losses, the development of risk maps and probabilistic models as well as a deeper understanding of underlying hazards can help provide more effective risk management.

AIR models give you the information you need to support your entire risk-decision chain. Learn about the AIR Model Advantage!

About AIR Worldwide

AIR Worldwide (AIR) provides risk modeling solutions that make individuals, businesses, and society more resilient to extreme events. In 1987, AIR Worldwide founded the catastrophe modeling industry and today models the risk from natural catastrophes, terrorism, pandemics, casualty catastrophes, and cyber attacks, globally. Insurance, reinsurance, financial, corporate, and government clients rely on AIR’s advanced science, software, and consulting services for catastrophe risk management, insurance-linked securities, site-specific engineering analyses, and agricultural risk management. AIR Worldwide, a Verisk (Nasdaq:VRSK) business, is headquartered in Boston with additional offices in North America, Europe, and Asia. For more information, please visit www.air-worldwide.com.