Categories

Flooded with new exposure

This article was first published in the Canadian Underwriter Dec 2019 Magazine where Canadian Underwriter interviewed Laura Twidle, Managing Director at CatIQ.

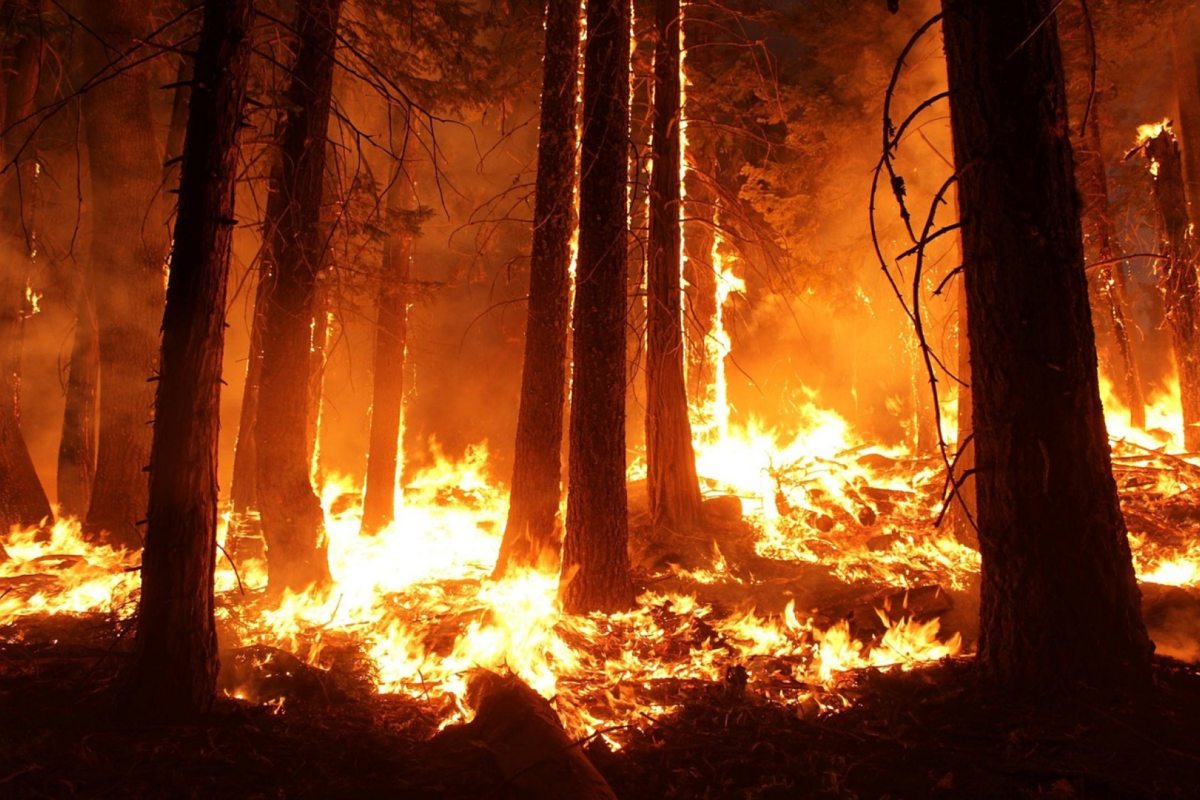
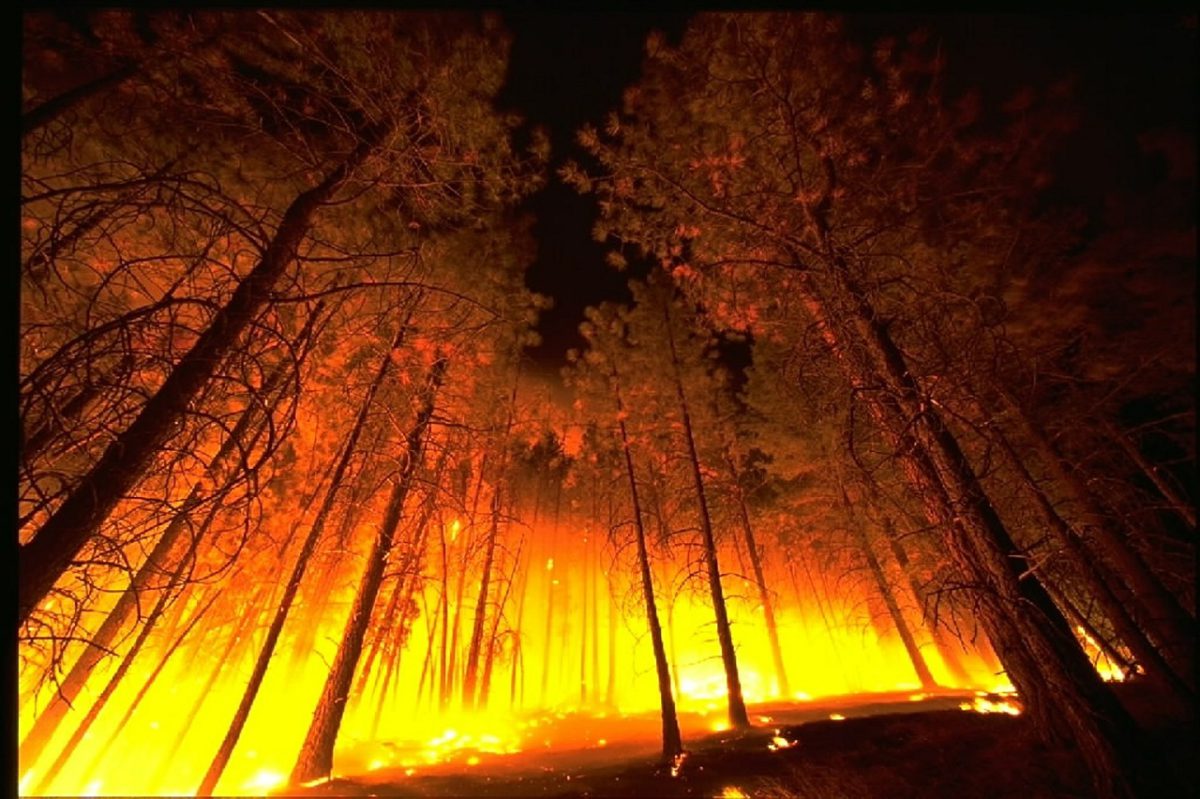
cu | Is it possible that over the long term, Canada’s P&C industry will be paying $2 billion annually to insure catastrophe damage? Yes, it’s certainly possible. There has been an upward trend of Cat losses and the industry has been increasing its exposure to flood and water. Of course, we have the large events like the Fort McMurray wildfire and the Alberta floods that could be considered to skew the timeline; but in 2018, there was no $1-billion event, and yet Cat losses were still greater than $2-billion. We are comfortably crossing the $1-billion mark every year, and have already done this in 2019. It wouldn’t surprise us to see an average $2 billion annually within the next few years.

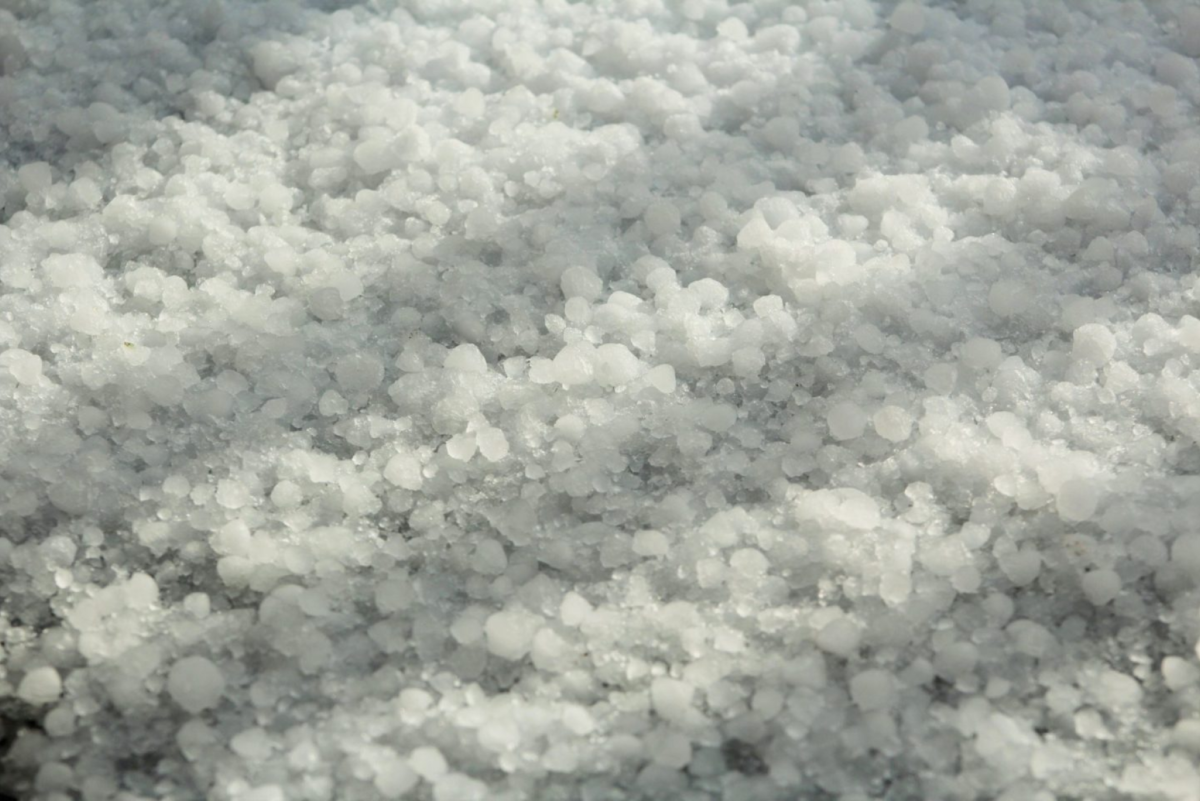
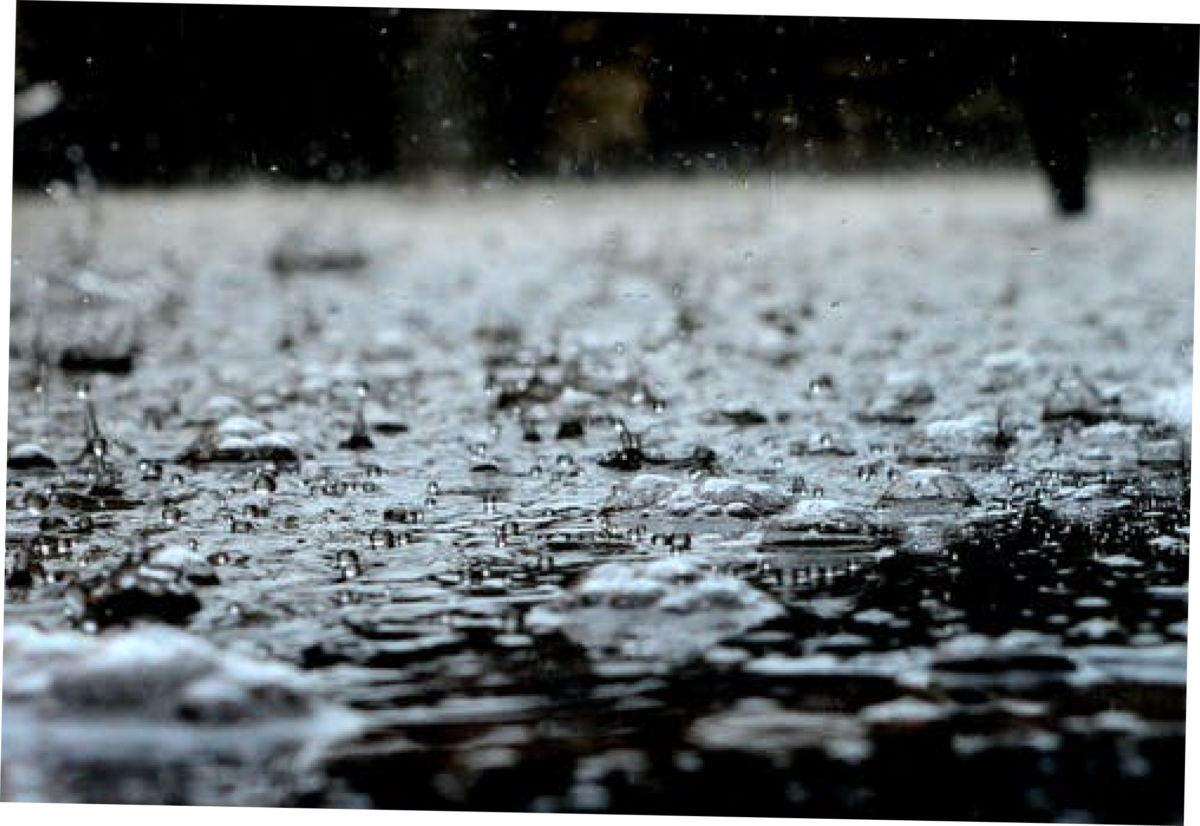
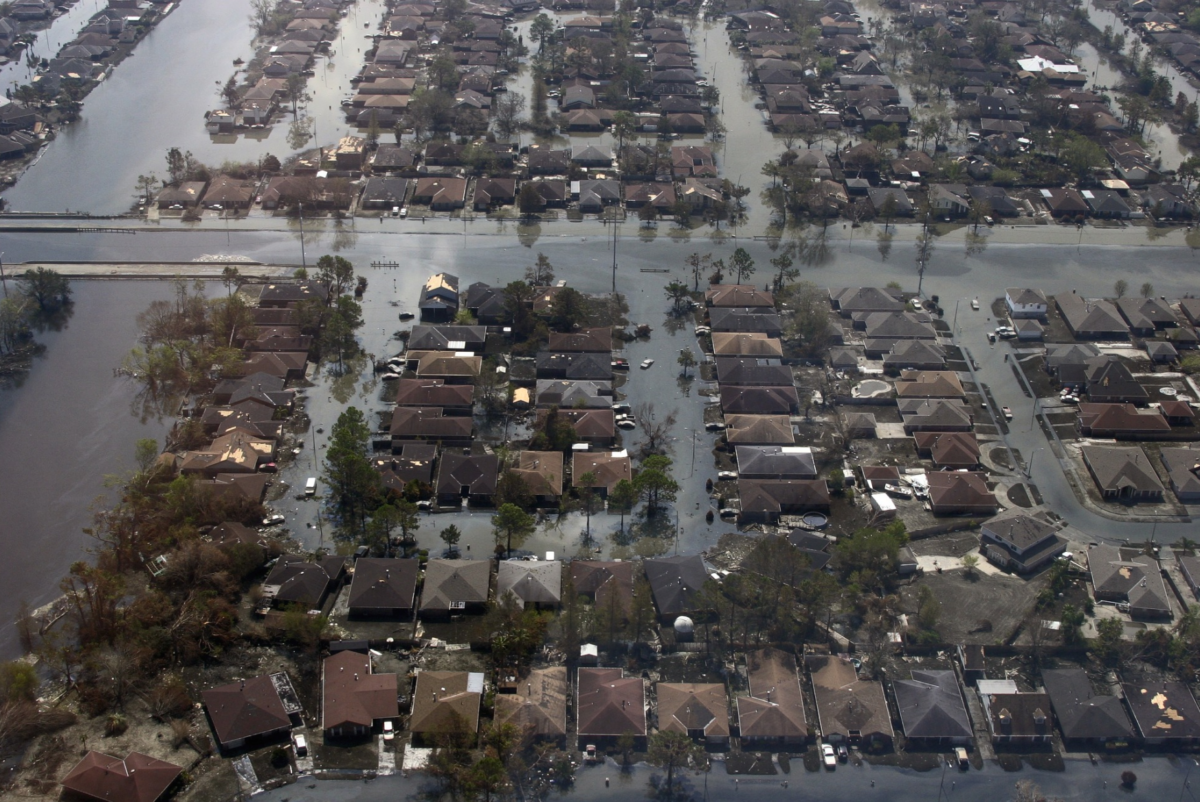
cu | You mentioned the industry increased its exposure to water damage when it started offering overland flood coverage in 2015. How does this play out in the Cat loss numbers? Since 2015, the percentage of Cat losses related to water has increased. In some years, this has been nearly a quarter of the annual loss.

cu | To what extent is climate change a factor in all this? In addition to the industry becoming more exposed to flooding, we’ve seen a lot more water-related events come into the picture over the past few years. Cat season was always defined as the summer due to severe thunderstorms in the Prairies, with hail and strong wind gusts bearing through in Western Canada. But since 2017, Ontario and Quebec have dominated the Cat losses. This year, we had five catastrophes in the first quarter, and the decadal average is one. Four out of five of these first-quarter Cats were mainly water-related; Greater Toronto Area (GTA) bore the brunt of these events. Several intermittent warm-ups with rainfall in the cold season resulted in seepage, ice damming, sewer backups, ice jams and overland flooding. With Canada experiencing a significant rate of warming, particularly in the winter, an active first quarter could become the norm and not just impact the GTA.

cu | Which part of the year is typically the worst for catastrophes? That’s been changing. Historically, what we’ve called Cat season is the third quarter, since July is typically when we see the most Cats and the most loss, mainly a result of severe thunderstorms in the Prairies. In 2018, we had more Cats in the third quarter, but the second quarter was more impactful due to loss mainly because of the May windstorm in Ontario and Quebec. This year, the first quarter was unusual. It was more impactful than the third quarter; if we include the April flooding in eastern Canada, the losses were significantly higher. Because of the spring Cats in Ontario and Quebec, we are seeing a shift in the timing of the peak for losses and events. One concern would be that the third quarter returns to being the peak Cat season, while the first and second quarters continue to experience significant Cat loss.

cu | What are the most common types of Cat claims? Cat claims relating to physical damage are more common than non-physical claims such as business interruption and additional living expenses. Regarding specific types of damage reports, claims relating to sewer backups, seepage, and wind damage — downed trees, torn shingles and siding, for example — occur year-round.

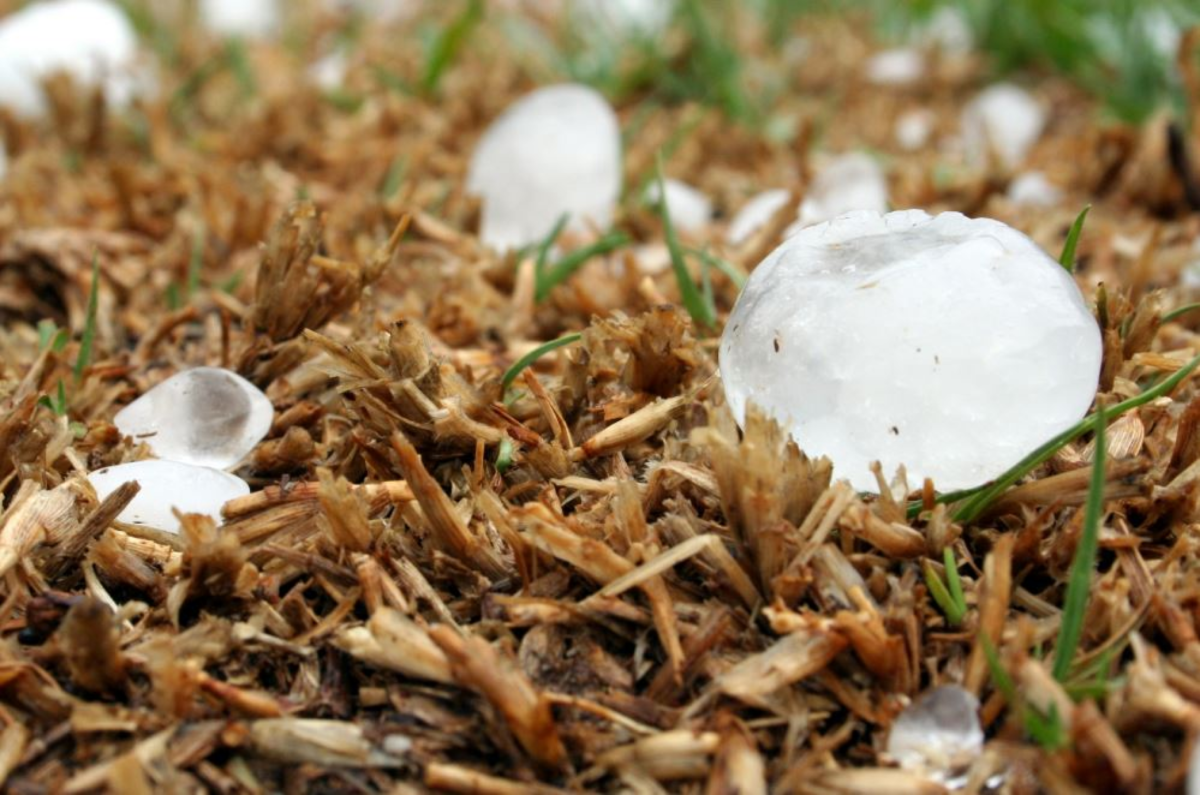
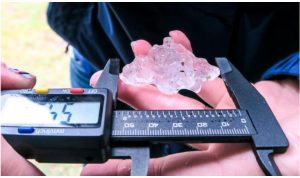
cu | Where in Canada are you most likely to see the most damaging Cat losses? Insured catastrophes happen where people are, so it’s heavily biased towards densely populated areas like the GTA. Atlantic Canada gets walloped with intense weather-systems frequently in the winter, and hurricanes in the fall, but from a Cat loss perspective, the area is less densely populated, and generally equipped to handle such storms. However, this is not always the case, as we saw from the damage caused by Hurricane Dorian this past September. In the interior of Canada, just off the foothills of Alberta, severe thunderstorms will always develop there. All you need is some atmospheric instability and easterly winds at the surface, and you have yourself a thunderstorm. If there is enough upper-level support in the atmosphere and wind shear, the storm might become severe and sustained to reach the highway that runs between Calgary and Edmonton. A significant portion of Alberta’s population lives along that corridor, and so that area will always be susceptible to severe thunderstorms that produce large hail, and damaging wind gusts and therefore Cat loss.

cu | Tell us a bit about the CatIQ Connect conference coming up in Toronto on Feb. 3-5, 2020. I understand you are taking a bit of a different approach to this conference. How so? CatIQ Connect is the annual Canadian Cat conference that brings together experts from the industry, all levels of government and academia to discuss best practices and innovative solutions to mitigating loss to Cats. The theme next February will be a solutions-based approach to Cats. We have already talked a great deal about the challenges that come from Cats. What we really want to do at CatIQ Connect 2020 is to say: ‘We all know this problem exists, and here is a potential solution,’ or ‘Here is the next step to mitigating catastrophic loss.’ Our steering committee has put together a great agenda featuring outstanding speakers. The 2020 keynotes include Roy Wright, president and CEO from the Insurance Institute for Business & Home Safety. We’ll have a fireside chat with Maryam Golnaraghi, director of climate change and emerging environmental topics of the Geneva Association. And we’ll hear from Kathy Bardswick, president and CEO of the Canadian Institute for Climate Choices. On the first day, we will host a workshop in partnership with the Canadian Red Cross. The next two days include jam-packed information sessions around many topics — flooding, earthquake, wildfire, mental health in disasters, from the on the ground perspective, financial solutions to climate change, resiliency, communication, and risk assessments.

Categories

Climate change and extreme weather

Increasingly, the climate change debate is part of the dialogue surrounding catastrophic weather events, including floods, fires and severe weather impacting Canada. Emerging research is focusing on how climate change may be impacting extreme weather events, and the insurance industry is grappling with how to respond to a changing landscape of risk. Set on a backdrop of normal climate variability through natural cycles, the impacts are also complicated by the complexity of the interaction between the ocean and atmosphere, and the arctic and mid-latitudes.  These teleconnections make it difficult to separate the signal from the noise.  The biggest question of all is whether the future will resemble the past.

An interesting starting point for all weather is in the arctic, and scientists are beginning to focus on the connections between the arctic and weather in the middle latitudes, especially in North America.  The term “arctic amplification” refers to the idea that the arctic is warming faster than anywhere else on the earth, and that the current warming accelerates future warming in a positive feedback loop.  Scientists often cite the shrinking extent of arctic sea ice as the primary driver of the warming.  As sea ice extent shrinks, the warm ocean surface is exposed to air, which has several implications.  A white ice surface reflects incoming solar radiation back to space, keeping the surface colder.  Conversely, a darker ocean surface absorbs incoming solar radiation, warming the ocean surface and also warming the lower levels of the atmosphere.  A warmer atmosphere can hold more water vapor, which is an important greenhouse gas.  So as arctic sea ice extent shrinks, the arctic atmosphere continues to warm more rapidly through these complimentary processes.

Figure 1:  Arctic (land stations north of 60°N) and global mean annual land surface air temperature (SAT) anomalies (in °C) for the period 1900-2015 relative to the 1981-2010 mean value (CRUTEM4 dataset)

Observations certainly support the theory that arctic amplification is leading to greater warming in the arctic than the warming being observed in the global average.  There has been an ~3 degree Celsius warming in the arctic since the beginning of the 20th century.  Seasonal anomalies have been quite profound.  Arctic sea ice extent reaches an annual minimum at the end of September each year.  At that point, the on-set of the arctic night triggers a freezing up of the sea.  However, for the past decade or so, this freezing up has been delayed due to anomalously warm temperatures in the late fall and early winter.  In November of 2016, temperatures were 20 degrees Celsius warmer than the daily average, and this coincided with a record low coverage of arctic sea ice.

Figure 2:  Daily temperature anomalies on Nov 17, 2016 when record high temperatures coincided with record low sea ice extent (ClimateReanalyzer.org)

Research indicates that another positive feedback cycle is emerging; namely that when the Arctic is very warm, it is leading to the jet stream taking wavier paths—big northward swings and southward dips. The jet stream is driven by temperature differences between the poles and the tropics.  Scientists have observed that the reduced temperature difference between the North Pole and tropics is associated with slower west-to-east jet stream movement and a greater north-south dip in its path. The poleward branch of this pronounced jet stream transports heat and moisture from deeper in the tropics north into the Arctic, which heats the Arctic more.

Figure 3:  Schematic of typical 1980’s sea ice extent and jet stream pattern (purple), contrasting with current artic sea ice extent (white) and the jet stream pattern of today (reds and blues) (SSEC at University of Wisconsin)

The real question is: how does this warming of the arctic affect weather in the middle latitudes, including North America?  The answer may lie in the physics and dynamics of a slower and wavier jet stream. This pattern causes a “stickiness” in the typical progression of storms.  Rather than moving along quickly, systems are beginning to stall and intensify, resulting in more extreme weather, including floods, large hail, and severe drought accelerating wildfires.

This type of ‘sticky’ jet stream pattern was in place during the on-set of the Fort McMurray wildfire.  A dome of persistent high pressure was in place over Northern Alberta for several weeks preceding the event, causing abnormally warm temperatures and a lack of precipitation that directly contributed to ample fuel for a large and damaging wildfire.  On the flip side of the coin, when stuck in the rainy part of the jet stream, extreme precipitation is possible. A study completed at the Prairie Climate Center in 2017 projected spring precipitation in the mid-century to be 40-50% higher than the baseline in some locations in Southern Alberta and Saskatchewan, resulting in the potential for massive flash flooding along the many rivers of the Prairie Provinces.

While observations and theory suggest that arctic amplification is already occurring and is going to be difficult to reverse, the actual impacts to communities in the northern hemisphere are still greatly uncertain.  As outlined above, there is an active research community endeavoring to shed light on the various potential impacts, including extreme weather that has the potential to change the landscape of risk in Canada.  Our existing tools rely heavily on the idea that the future will resemble the past; it is, therefore, imperative that the insurance industry continue to develop innovative approaches to managing risk, and partner with the academic community to better understand the problem and customize solutions.

Categories

Future hail and severe weather environment

Three model pairings (HadCM3-MM5; HadCM3-HRM3 and CCSM3-MM5) from the North American Regional Climate Change Assessment Program (NARCCAP) (Mearns et al. 2012) were used to assess future (2041-2070) hail and severe weather climate west of the continental divide based on the SRES A2 emission scenario. In addition, for the first time, a hail model (HAILCAST; Brimelow et al. 2002) was run using the NARCCAP models to explicitly project future changes in hail characteristics.

According to Brimelow et al. (2017), by midcentury, we may see an overall decrease in the number of severe weather days in southern Saskatchewan and Manitoba in the summer (with no change in the spring), though when it does occur, it could potentially be more severe (with respect to wind and tornadoes). However, changes in hail are not obvious due to the increasing height of freezing levels that tend to melt hail more readily.

The decrease in future severe weather days in southern Saskatchewan and Manitoba may be due to increased capping (i.e. warm air above the ground that inhibits storm formation). Much of Alberta may experience an increase in damaging hail in the summer, when storms do occur.

There does not appear to be much of a future change in severe hail days over southern Ontario, however, when hail does occur, it may potentially be larger (in spring, not summer) partially due to higher freezing levels, so as to melt smaller hail before it reaches the ground. In addition to larger hail, southern Ontario may also experience an earlier occurrence of large hail in the spring period.

Over all regions, the common ingredient that creates conditions for more intense storms is an overall increase in atmospheric moisture, caused by increased future warming that increases storm energy (when storms do occur). These results are broadly consistent with other U.S. research (e.g. Allen et al. 2015; Trapp et al. 2009; Van Klooster and Roebber, 2009), although future changes in the summer jet stream affecting southern Canada may not substantially decrease like the U.S. This is partially why parts of the southern Canadian Prairies may not see decreased severe weather potential in summer.

References

Allen, J. T., Tippett, M. K. & Sobel, A. H., 2015:  An empirical model relating US monthly hail occurrence to large-scale meteorological environment. J. Adv. Model. Earth Syst. 7, 226–243.

Brimelow, J. C., Reuter, G. W. & Poolman, E. R., 2002: Modeling maximum hail size in Alberta thunderstorms. Weath. Forecast. 17, 1048–1062.

Brimelow, J.C., W.R. Burrows and J.M. Hanesiak, 2017: The changing hail threat over North America in response to anthropogenic climate change. Nat. Clim. Change, DOI: 10.1038/NCLIMATE3321.

Mearns, L. O. et al. 2012: The North American regional climate change assessment program: overview of phase I results. Bull. Am. Meteorol. Soc. 93, 1337–1362.

Trapp, R. J., Diffenbaugh, N. S. & Gluhovsky, 2009: A. Transient response of severe thunderstorm forcing to elevated greenhouse gas concentrations. Geophys. Res. Lett. 36, L01703.

Van Klooster, S. L. & Roebber, P. J., 2009: Surface-based convective potential in the contiguous United States in a business-as-usual future climate. J. Clim. 22, 3317–3330.

Fighting Historic Wildfires Amid Bad Ideas and No Funding

The below article is by Ed Struzik. Ed will be a keynote speaker at CatIQ Connect in February 2019. http://www.catiq.com/connect

Note that this article originally appeared in The Conversation.

Shortly after my book “Firestorm, How Wildfire Will Shape Our Future” was published in late 2017, I received a flurry of invitations to speak about the challenges of dealing with fires that are burning bigger, hotter, more often — and in increasingly unpredictable ways.

The invitations came from all over, from Los Angeles to Whitehorse in the Yukon and from Campbell River on Vancouver Island, to Portland, Me.

I had serious doubts that anyone in Whitehorse would come out to hear me speak on a Saturday night in the dead of winter when it was close to -30 C.

It turned out to be standing room only.

The invite came from a group of concerned citizens, business leaders and the Yukon Science Institute. The attendees included homeowners, firefighters, emergency response personnel and Yukon cabinet minister John Streicker, who is responsible for the wildfire management division.

The discussion that followed my talk was heated at times, but it led to an open and frank conversation on how this boreal forest community, and others like it, might deal with wildfires like the one that engulfed Fort McMurray, Alta., in 2016 and those that are burning big in British Columbia this summer.

INVESTING IN THE FUTURE

More and more Canadian communities are signing up for the very sensible Fire Smart program, which promotes a variety of preventative measures such as forest thinning and the use of fire-resistant building materials to reduce the impact of fire.

Vulnerable towns like Nelson, B.C., are on the right track in developing evacuation plans and encouraging people to keep enough food and water on hand to sustain them for 72 hours. First Nations communities in B.C. are working with scientists like Lori Daniels to make their communities and forest-management zones more resilient.

But there are also a lot of poorly thought-out proposals being made.

Some residents of Jasper are pressuring Parks Canada to clear-cut the forests around town to form a fire break to protect it.

Across North America, the logging industry is lobbying governments to salvage the healthy trees and the partially burned ones that remain in a burned-out area. The rationale in this case is that a dead or dying forest has little value other than boosting a local economy.

There is a significant role for the timber industry in managing wildfire in the future. But a growing number of studies show that clear-cutting a burned-out forest is not the answer.

Fire is a natural process that makes forests more resilient to drought, disease and future fires. And it’s good for wildlife.

Woodpeckers, nighthawks and many species of owls thrive in burned-out areas. Elk and moose feed on the aspen shoots that rise up quickly after a fire. Grizzly bears and black bears benefit from the roots and berries that do well when a fire exposes the forest floor to sun and rain. Rivers and lakes tend to heat up in nasty ways when there are no trees to shade them and the cold-water fish they nurture.

There is also tendency to think that the best way of dealing with fire is to pour more money into traditional firefighting resources. When I spoke at the University of California, Los Angeles in April, many people in the audience called for more water bombers and irrigation systems.

While this helps, it’s not the whole answer. The only thing that is going to stop a big wind-driven fire that typically blows in from the east is the Pacific Ocean, Ralph M. Terrazas, the fire chief of the Los Angeles Fire Department, said during the question-and-answer session that followed.

BRAVERY ALONE WON’T KEEP WILDFIRE OUT OF TOWN

Author: Glenn McGillivray, Managing Director, Institute for Catastrophic Loss Reduction (ICLR)

On a recent long haul flight I finally broke down and watched ‘Only the Brave’, the 2017 Josh Brolin movie about the 19 wildland firefighters killed at Yarnell Hill, Arizona in June, 2013.

Up to that point, I had refused to watch the movie, thinking that it would likely romanticize wildland firefighting and demonize wildland fire.

I refused to watch the movie like I refuse to call the Fort McMurray wildfire ‘The Beast’, an overly romantic moniker coined by the now retired fire chief of that city who gave the fire the qualities of an evil, soulless creature. I didn’t (and still don’t) see the benefits of animorphizing the fire, making it seem like a rational, calculating, punitive creature. In my view, it helps no one to imply that such a fire is some kind of intentional being with a mind of its own. We won’t work to prevent such an event from reoccurring with such a mindset.

I remain dedicated to not calling the Fort McMurray fire that name, though I admit I was largely wrong about the movie. It is a pretty good flick, though there is one part where the fire superintendent (played by Brolin) looks over the expanse of scrub in his protection zone and says something to the effect that he and his crew “protect all of this.’

The idea of ‘protecting’ a forest against fire is largely the wrong stance to take (especially in Canada’s boreal forest, which needs fire for its own good). It is this ‘suppression at all costs’ mentality that has gotten many North American jurisdictions into the mess they are currently in, i.e. where years of successful suppression has ensured that wildlands are choked with fuel that’s now just waiting to go up like a tinder. In large measure, saying we need to stop fire on the landscape is akin to saying we have to stop the wind or the rain.

But I don’t wish to spend my time here talking about the issue of suppression. I deal with that here.

Instead, I want to put forth an idea of how we can better understand the interface fire problem (i.e. the issue of fire getting into communities), at least partly by looking at what we’ve learned from the past.

In the distant past, several major cities, mostly in Western Europe and North America, have experienced large conflagrations caused by one thing or another (like rambunctious cows). Fires in such places as London, New York, Toronto, Chicago and San Francisco lead to many changes in how cities are designed, how buildings are constructed, and in fire education and safety.

I suspect that these fires were largely viewed in technical terms and, thus, were seen as addressable, where measures could be put into place to prevent or, at the very least, reduce the risk of reoccurrences.

Firewalls were placed within and between buildings; openings (like small windows) were limited on the exposure sides of buildings; fire doors became common; buildings were outfitted with fire alarms, suppression equipment with dedicated water supplies and, from the late 19th century, sprinkler systems; less wood was used in construction; open flames were limited, and so on. Parallel to these efforts came the rise of education programs to inform people about the risk of fire and actions they could take to limit ignitions and spread. Over time, both the frequency and severity of urban fires dropped precipitously, to the point where fires are no longer a major cause of death and the main cause of insured property damage in most industrialized countries.

These actions are essentially early examples of risk management and are largely still in practice today. Indeed, it is still common for the risk manager of, say, a factory or mill to do a walk around of a site and make recommendations about how to prevent ignition and spread of fire.

But we don’t take this approach with homes in the interface. Why?

First, wildfires are viewed as ‘natural disasters’, and there is a widespread view that “nothing can be done about natural disasters” – they occur at the whim of Mother Nature. Really, though, a wildfire is a natural hazard, the disaster comes when the hazard exploits manmade vulnerabilities. I think the view that losses are inevitable when a hazard strikes is leading to inaction when it comes to wildland fire. For some reason, we treat the prevention of interface fires differently than we treat the prevention of other fires. But fire is fire.

Second, people have a misconception about wildfires and the interface, believing that wildland fires roll through the forest, hit a built up area and keep rolling. But what largely happens is that embers from the wildfire are blown far ahead of the fire front and ignite flammable materials located around structures. These materials then either ignite the structure directly, or ignite something else (like a wood shed or deck) that in turn ignites the structure. This is what largely occurred in Fort McMurray. It is also what occurred in the Tubbs Fire in Northern California in October 2017, except the embers travelled very deeply into the urban core of Santa Clara, leading to the incineration of about 2,800 homes, mostly in the Low Risk part of town (as designated by the city’s statutory state wildfire risk maps). These maps apparently did not take the state’s often intense Santa Ana winds into consideration.

Once you realize that wildfires are not juggernauts that roll through town like a steamroller and that structural ignitions from wildfire embers are preventable, then you can put programs into place to address the issue of flammability of individual structures, subdivisions and entire communities located in the interface.

One problem I see is that we may be talking too much to the wrong folks; to wildland fire experts and not to structural fire experts, fire modellers and other urban fire experts.

Now don’t get me wrong. Wildland fire experts, including fire ecologists and wildland fire suppression experts, are key throughout the entire lifecycle of a wildland fire – (long) before, during and (long) after. And we need to recognize that the condition and health of the forest around the interface community will largely dictate how intense the fire will be, the rate at which it spreads, and the amount of embers that are produced (the greater the fine fuels, the more embers).

But once a wildland fire gets into town, the fire stops being a forest fire and starts a new life as an urban fire, possibly becoming an urban conflagration or ‘firestorm’ if enough structures are ignited (often via structure to structure spread of fire).

So we have to recognize that once the fire hits town, it becomes a different fire, feeding on different fuels (like structures and vehicles). A fire ecologist, for example, has no expertise in the mechanisms that lead to structural ignition and spread of fire in an urban setting.

Thus, we need to bring structural or urban fire departments and experts into the discussion and leverage their knowledge (of course, many are already involved in the discussion, but many are not).

We have to pull in such organizations as the Canadian Association of Fire Chiefs, the Aboriginal Firefighters Association of Canada and their provincial counterparts, as well as provincial firefighter associations.

We need to bring in such researchers as fire modellers, to better understand how fire grabs hold and spreads in urban areas (we know what causes structures to ignite, but need to do more to understand how entire subdivisions are lost) and the sequence of such spread. Some work has already been done in the fire following earthquake research area, and much of the learnings there can be carried over to wildland urban interface fire research.

Essentially, we need to take the same approach with wildland fire in interface communities as we do with all other urban fires, including urban conflagrations.

This can only start by talking to the right people.

HAIL CLIMATOLOGY FOR CANADA: AN UPDATE

Article written for the Institute for Catastrophic Loss Reduction’s (ICLR) Cat Tales, January/February 2018:

On February 15, ICLR released Hail climatology for Canada: An update. The report was written by David Etkin, Associate Professor of Disaster Management at York University.

The paper serves as an update to Etkin’s Canada’s Hail Climatology: 1977-1993, prepared for ICLR in April 2001. The update is based on an objective analysis of hail observation station data from 1977 to 2007.

National hail climatologies (i.e. the number of hail days per year in Canada) serve as a foundation for hail risk analyses. Although national hail climatologies cannot be used to determine hailstorm severity or to infer damage, they are used to help identify vulnerable regions, and thus areas where mitigation efforts should be concentrated.

Hail days data for the analysis was obtained from the Digital Archive of Canadian Climatological Data, Environment Canada from all hail observing stations in the country. For each station, monthly days-with-hail were calculated where the number of missing observations were less than four days in any month. This represents 96.7% of the records. Monthly hail days were adjusted for missing data by multiplying the unadjusted hail-day observation by the factor [1+ (number of missing days) ÷ (number of days in the month)].

A trend analysis showed no change in hail frequency for Ontario, in contrast to other studies that have examined severe hail frequency and tornado frequency. Alberta, by contrast, showed a significant increase in hail frequency during the period 1977 to 2007.

Manitoba and Saskatchewan showed decreasing trends. Future research could examine in more detail which areas exhibit increasing or decreasing hail frequencies, and how those seasons correlate with larger scale climate drivers.

Etkin warns that further hail research would be constrained by the lack of ongoing hail observations by Environment Canada. Hail observations at Environment Canada weather and climate stations were not widespread until 1977, he notes. After 1993 the number of hail observing stations began to decline and after 2005 the number of stations reporting hail dropped precipitously. After 2007, he reports, the number of observation stations was trivial. Other datasets would have to be used, such as those created by radar and satellite imagery.

In the 1990s and early 2000s, ICLR conducted a number of studies focused on understanding the risk of hail damage in Canada. The hail research needs of insurance companies was acute before ICLR was established when Canada’s most costly hailstorm struck Calgary in 1991. In particular, ICLR published an earlier hail climatology (1977-1993) and conducted several workshops where hail was considered as part of a broader discussion of convective storm-related losses.

Institute members also contributed to an industry discussion that lead to the creation of the Alberta Severe Weather Management Society.

Fortunately, there were few large hail damage events in Canada between 1991 and 2008. Indeed, there was a period of almost ten years when the Institute received virtually no requests from member companies to study the peril. The industry directed ICLR to focus its research on other hazards, including the alarming increase in water damage. Indeed, hail research was not included in the Institute’s last five-year plan.

However, hail damage claims have ramped up in Canada in recent years. Just three wind/water/hail events in Alberta (2010, 2012 and 2014) totaled more than $1.66 billion in insured losses. As a result, in 2015 Canadian property and casualty insurers – through ICLR’s Insurance Advisory Committee – formally asked the Institute to investigate the peril and suggest actions insurers can take to mitigate future hail losses in the country.

Conducting an updated climatology of hail is key to understanding the current state-of-play for the hazard before more in-depth research is pursued.

Prior to joining York University, David Etkin worked for 28 years with the Meteorological Service of Canada in a variety of fields, including operations and research. He has been an associate member of the School of Graduate Studies at the University of Toronto since 1994, doing research on natural hazards, teaching and supervising graduate students. In 2003 he was awarded the Environment Canada Award of Excellence. Prof. Etkin has participated in three international hazard projects and was one of only two non-Americans to assist with the U.S. 2nd national assessment of natural hazards. He has been principal investigator for a NATO short term project on natural hazards and disasters and the Canadian Assessment of Natural Hazards Project that resulted in the book An Assessment of Natural Hazards and Disasters in Canada, which he edited. The summary report he wrote of this latter project has been widely distributed within Canada and was used by Public Safety Canada and Foreign Affairs Canada as the official Canadian contribution to the recent ISDR Kobe disaster conference. CT

Link to report: https://www.iclr.org/images/Etkin_Hail_report_Feb_2018.pdf

The Hurdle of Replacement Cost Value (RCV) to Building Back Better

The Hurdle of Replacement Cost Value (RCV) to Building Back Better

  • Emily Stock, lawyer, Monaghan Reain Lui Taylor LLP

When we discuss the concept of building back better, we all agree that it is great.  Who can oppose making our communities, infrastructure and people more resilient to catastrophes.  We also recognize that there are a multitude of hurdles to consider, and that underlying many of those hurdles is an often inflexible legal regime.

Understanding property insurance coverages is significant to any policy for building back better.  Typically property insurance policies provide for some combination of Actual Cash Value and Replacement Cost Value, depending on a variety of criteria.

Actual Cash Value (ACV) is also sometimes referred to as market value.  It is intended to be the dollar amount you could expect to receive for the item if you sold it in the marketplace.  It thus takes into account depreciation of the property.  An insurance company determines the depreciation based on a combination of objective criteria (a formula considering the category and age) and a subjective assessment in the marketplace.  The result is that if a homeowner receives ACV they technically receive exactly what they lost (i.e. the value of an old house); however they cannot afford to replace their property (i.e. build a new house).

Replacement Cost Value (RCV) is the cost to replace the property.  It insures the depreciation of the property, so that the homeowner receives the cost to build a new house similar to the house they lost.  When we talk about building back better, the homeowner can typically only afford to rebuild if they are able to obtain RCV.

The difficulty in obtaining RCV is that it is typically only available where the rebuild is:

(a)        at the same site or location; and,

(b)        uses materials of “like kind and quality.”

But what if being at the same location, or building the like kind and quality, is not building back better?  Consider if the insured event is a flood in an area that is now prone to flood zones.  We don’t want to encourage that homeowner to rebuild in the same location, despite there being significant financial incentive for them to do so.  Similarly if the event is a fire, we know that we don’t want to require that the rebuild use the same non-fire resistance materials (i.e. siding, roofing materials), or even to rebuild the same type of structure which may have been inappropriate for the location recognizing the changing environment.

Although we recognize that the wording of the policy must define the rights of the homeowner, and the monetary obligation of the insurer, I expect we would also agree that it seems unfair to require the homeowner to rebuild at the same site, or use materials of like kind and quality, where such is contrary to the principles of building back better.

In considering this conundrum, it is helpful to consider the rationale for RCV, as recently articulated by the Ontario Court of Appeal in Carter v. Intact.  After recognizing that replacement cost insurance is justifiable even though it provides the policyholder with greater value than what they lost, the Court explained the following as to why the limitations on RCV are reasonable and required:

… allowing insureds to replace old with new raises a concern for the insurance industry. The concern is moral hazard: the possibility that insureds will intentionally destroy their property in order to profit from their insurance; or the possibility that insureds will be careless about preventing insured losses because they will be better off financially after a loss.

To put a brake on moral hazard, insurers will typically only offer replacement cost coverage if insureds actually repair or replace their damaged or destroyed property. If they do not, they will receive only the actual cash value of their insured property.

It is clear from this reasoning that there is little to no risk of the moral hazard in catastrophic insured events.  There is similarly no risk of the moral hazard where an insured homeowner does not want to comply with one or both of the criteria to receive RCV, same location and/or like kind and quality, because of a desire to build back better.

As an advocate for encouraging the insurance industry to build back better, we therefore advocate thoughtfully reducing the two criteria for building back better.  This could be done proactively by deleting the same location requirement in policies in flood or other risk zones.  The like kind and quality criteria should also be carefully examined for certain types of insured events (i.e. fires), so that more appropriate materials can be agreed upon before the event as acceptable under the policy.

An important step to reducing these types of hurdles is to continue and develop the conversation, which I look forward to doing at the CATIQ Canadian Catastrophe Conference in 2018, and beyond.

IMPROVING WILDFIRE AND FLOOD RISK MITIGATION IN CANADA

Improving Wildfire and Flood Risk Mitigation in Canada

Author: Alan Frith, CPCU, ARe, CEEM

Canadians have suffered an increasing number of natural and man-made disasters that have devastated communities and cost insurers more than CAD 5 billion in 2016 alone. With decentralized regulation and prevention efforts, the growing financial fallout is only likely to worsen. CatIQ’s Canadian Catastrophe Conference, January 31 – February 3, 2018, will bring together industry, academia, and government to discuss Canada’s natural and man-made catastrophes. I will be sitting on a panel discussing the viability of the Alberta property insurance market in light of recent catastrophic events.

For insurers, an accurate and objective view of risk, reinforced by an up-to-date insight into the exposure, is crucial to maintaining financial stability. Managing catastrophe risk through historical losses alone is unreliable and volatile. Organizations must seek out the most comprehensive information available to understand how rapidly changing environmental characteristics alter their risk profiles.

Let’s examine two of the perils that have recently caused significant losses in Canada to understand how risk assessment tools can be used to quantify the impact of these kinds of events.

Wildfire

High-resolution satellite imagery enables us to develop an in-depth understanding of land use/land cover and is a critical piece of the risk mitigation framework. Using this imagery, risk modelers can construct an accurate map of potential fuel sources, a fundamental requirement for effectively modeling wildfire spread. Dense or dry vegetation, for instance, allows a fire to spread easily, while roads, rivers, or even mountains serve as natural firebreaks. Depending on the local distribution of fuel sources, the interaction between different types of fuels, and the gradual evolution of the surrounding landscape, your portfolio’s exposure may very well outpace your organization’s risk appetite over time.

It’s also important to monitor the effect of population movement. Rapid residential and commercial/industrial growth deeper into areas of combustible fuel, the Wildland Urban Interface (WUI),  exposes properties to greater wildfire risk. For organizations underwriting property risk in Canada, one fire in recent memory certainly stands out from the rest, demonstrating well the dangers of increased development in the WUI.

In 2016, the Fort McMurray fire blazed through the surrounding areas of northeastern Alberta, causing unprecedented devastation and destroying up to 80% of homes in some neighborhoods. A hub of oil production in Canada, the town had experienced a 30% population boom between 2006 and 2011 as people moved to the area to take advantage of job opportunities at the many mines and oil sands refineries in the area. The increased presence of residential structures among dense forest helped the flames spread quickly and resulted in insured losses of nearly CAD 4 billion – making it the costliest natural disaster in Canadian history. Although the oil facilities and pipelines themselves avoided damage, oil companies suffered significant business interruption losses as firefighters struggled for months to contain and extinguish the fires.

Flood

Detailed satellite imagery, coupled with high-resolution elevation data in the form of digital terrain maps (DTMs), is also used to build floodplain maps, which play an important role in evaluating flood risk. Reliable model output for this peril is highly dependent on precise exposure locations, as small changes to a location’s elevation or proximity to floodplains can have a significant impact on potential losses. The development of risk mitigation strategies, such as strict building codes and zoning laws, can help prevent these losses, so long as these codes are followed and the laws are enforced. Government agencies must consider the effect that unchecked commercial development—and the associated infrastructure of roads, sidewalks, and parking lots—can have on the larger ecosystem, especially during a natural disaster. The consequences of unregulated urban sprawl were recently seen in Houston, Texas, during Hurricane Harvey: Severe flooding was caused in part by floodwater that had inadequate access to natural drainage, such as undeveloped prairie and marshland areas.

Although flood is by far the most frequent natural disaster in Canada, preventive efforts are largely decentralized. For residential structures, overland flood damage has only recently been included as a covered peril by private insurance. In many cases, it’s a common exclusion from homeowners’ policies, with catastrophic losses ultimately falling in taxpayers’ laps via government emergency funds. With multiple catastrophic flood events in the past seven years, each causing billions of dollars of losses, it’s imperative to mitigate risk through preventive measures. This includes building flood defense systems as well as encouraging homeowners in and around potential flood zones to purchase policies that protect them against flood loss.

What’s Next?

Governments, insurers, and homeowners need to work together to reduce losses caused by natural disasters. It’s encouraging to see mitigation efforts gaining momentum, but there is much more work to be done. While government can manage building codes and zoning laws, it’s also up to insurers to carefully evaluate their risk profiles and exposures to ensure that they continue to maintain adequate reserves in the event of a catastrophe.

A useful first step in risk assessment is a detailed hazard map. These maps indicate the associated risks for perils such as wildfire and inland flood for a range of return periods, such as 100, 250, and 500 years. The logical next step to advance your risk evaluation strategy is to use a probabilistic model.  These models use advanced simulation methods to provide valuable metrics such as Average Annual Loss (AAL), Tail Value at Risk (TVaR) and a full Exceedance Probability (EP) Curve, from portfolio level down to individual exposures.

The Geospatial Analytics Module in AIR’s Touchstone® platform lets you seamlessly integrate exposure information with location-specific hazard maps, including wildfire fuel layers and flood inundation footprints for Canada. In addition, AIR offers probabilistic models for earthquake, crop hail, severe thunderstorm, winter storm, and tropical cyclone in Canada; models for wildfire and flood are being developed. As the insurance industry in Canada continues to cope with recent losses, the development of risk maps and probabilistic models as well as a deeper understanding of underlying hazards can help provide more effective risk management.

AIR models give you the information you need to support your entire risk-decision chain. Learn about the AIR Model Advantage!

About AIR Worldwide

AIR Worldwide (AIR) provides risk modeling solutions that make individuals, businesses, and society more resilient to extreme events. In 1987, AIR Worldwide founded the catastrophe modeling industry and today models the risk from natural catastrophes, terrorism, pandemics, casualty catastrophes, and cyber attacks, globally. Insurance, reinsurance, financial, corporate, and government clients rely on AIR’s advanced science, software, and consulting services for catastrophe risk management, insurance-linked securities, site-specific engineering analyses, and agricultural risk management. AIR Worldwide, a Verisk (Nasdaq:VRSK) business, is headquartered in Boston with additional offices in North America, Europe, and Asia. For more information, please visit www.air-worldwide.com.

IMPROVING SAFETY THROUGH SIMULATING WILDFIRE RESPONSE

Improving Safety Through Simulating Wildfire Response

Steven Gwynne, Ph.D., Research Officer, NRC Construction – Fire Safety, National Research Council Canada

Wildland fires represent an important safety issue in many regions of the world – including Canada. This is complicated by the current location and possible future expansion of wildland-urban interfaces (WUI) posing severe challenges from a community evacuation perspective. Large WUI fires, like the recent Fort McMurray fire, are associated with severe negative consequences including massive community evacuation, property losses, social disruption, short- and long-term damage to infrastructure, injuries, and in some instances fatalities of evacuees and responders. Tools to assist planning and response are essential to provide evidence to planners, evacuees and responders to better address these challenges.

As we go forward, it is expected that droughts will get more severe and prolonged, thunderstorms more frequent, wind patterns will change and harsh hot seasons will affect new regions. Current trends in community planning show that more people are inhabiting areas that are now or soon to be vulnerable to WUI incidents. Housing developments in WUI areas are particularly appealing given their low cost, access to recreational pursuits, and the aesthetic benefits of being closer to nature. Therefore, WUI incidents are likely to become more severe and affect new areas and those areas already susceptible to wildfires.

The social and physical geography associated with WUI communities present a special challenge that needs to be addressed when ensuring life safety. In order to successfully respond to a wildfire incident, those involved must have an understanding of current and future events enabling them to reach safety or facilitating others to do so. Decisions made during community planning, property upkeep, emergency planning, public education, responder training, and during the evacuation itself are all heavily reliant on the information available. To ensure that this preparation and response is adequate, the effectiveness of the pre-incident decisions and decisions taken during the incident needs to be understood to allow assessment of these decisions before they are finalised and executed; i.e. before they are put into practice in the real-world. This effectiveness is reliant on the accuracy and completeness of the information available.

Very often, the wisdom derived from previous wildfire disasters is the only available source to identify current scenarios of interest and plan the response of a given community. However, there is no guarantee that these past experiences correlate well with the next disaster to be faced or with the conditions that might contribute to the outcome of the incident in the current context – especially given the expected evolution of WUI incidents. In this context, a simulation framework that can establish evacuation performance ahead of time, and that is capable of examining different designs and response scenarios would be very useful. Such a computational framework might be used to predict how the evacuation develops based on different fire scenarios (different origin, speed, development, etc.) and according to different evacuation decisions (e.g., staggered evacuation by neighbourhoods, the arrangement of traffic flow on highways, or the appearance of congestion). Moreover, current resources do not allow for the impact of procedural decisions to be assessed (and quantified) before they are executed; i.e. how conditions might evolve and might affect and be affected by an evacuating community. This is an important limitation in current approaches – that cater to understanding the current situation but cannot provide numerical evidence to support procedural decisions given forecasted changes in conditions. To do this, simulation tools are needed to explore the development of a wildfire, and the impact that it has on the response (e.g. evacuation using vehicles or on foot) – to identify current and future vulnerabilities and inform ways of addressing it. This might then provide an additional tool for planners and responders in their attempts to address WUI life-safety issues as we go forward.