Flood insurance take-up in Canada, 2021

In this article, we examine trends in overland flood insurance take-up across Canada based on the 2021 CatIQ exposure data release. Flood-related events have caused over $5.5 billion in insured losses in Canada from 2012-2021. With climate change, losses to flood in Canada are expected to increase. Flood insurance can be an important tool to finance these losses if it is adopted widely across Canada. While overland flood insurance coverage for personal homes was introduced in Canada in 2015, its addition as a rider to insurance policies is optional and take-up varies dramatically across the country and over time.

We track personal flood insurance take-up in CatIQ data as a fraction of personal fire insurance take-up. In Canada, flood insurance exists as an additional endorsement to a homeowner’s or tenant’s insurance policy. We consider take-up both by number of policies (dividing number of flood insurance policies by fire insurance policies) and by value of insured property (dividing sum of buildings and contents covered by flood insurance policies by the same for fire insurance policies). These numbers tend to be similar; when take-up by the value of policies exceeds take-up by number of policies, it suggests more valuable assets are more likely to be insured for flood. Please note this metric should not be interpreted as the overall penetration of flood insurance in a region since not all homeowners and tenants have insurance.

Flood insurance take-up rates have grown steadily over time in Canada. In 2016, the first year of data available in CatIQ and one year following its introduction, flood insurance take-up rates were roughly 25% of that of fire insurance. Flood insurance take-up grew steadily to just under 40% by 2018. In 2021, the latest data release, roughly 55% of personal insurance policies have flood insurance. However, flood insurance take-up is still low across many parts of the country. Tables 1 and 2 show the personal flood insurance take-up rates as a fraction of fire insurance by number of policies and by value, respectively, across the provinces of Canada. There is significant variation in flood insurance take-up rates across the provinces. Manitoba had the lowest flood insurance take-up rates in Canada, with the next-lowest province having almost double the flood insurance take-up rates. By contrast, Alberta, British Columbia, Nova Scotia, Ontario, and Quebec had over half of personal lines with flood insurance coverage in 2021.

Table 1. Flood insurance take-up as fraction of fire insurance, by number of policies

 CANABBCMBNBNLNSONPEQCSK
201838%27%39%11%28%26%27%40%17%45%31%
202154%53%55%20%42%38%54%57%37%57%42%
Source: CatIQ and ICLR

Table 2. Flood insurance take-up as fraction of fire insurance, by value insured

 CANABBCMBNBNLNSONPEQCSK
201839%30%45%10%31%32%31%42%21%42%30%
202155%59%53%19%41%46%54%58%38%58%41%
Source: CatIQ and ICLR

The territories of Northwest Territories, Nunavut, and Yukon have flood insurance take-up rates very similar to those of the rest of Canada in 2021. As a fraction of total values insured, they were 43%, 58%, and 43% respectively. The rate of growth of flood insurance take-up over the past 3 years was much higher in the territories. Flood insurance take-up averaged below 5% of fire insurance take-up in the territories in 2018.

Flood take-up rates within provinces vary dramatically across Forward Sortation Areas (FSAs), or 3-digit postal codes. Generally, flood insurance take-up rates were higher in metropolitan FSAs compared to rural FSAs. In the denser metropolitan FSAs, flood insurance take-up rates often exceed 70% of the fire insurance take-up rates. Some FSAs even see 80% or 90% take-up of flood insurance. In contrast, rural FSAs rarely exceed 60% take-up of flood insurance even in provinces with higher take-up rates.

Figure 1 maps Alberta’s flood insurance take-up by FSA, along with a zoomed-in look at the denser Calgary and Edmonton metropolitan areas (an unfortunate limitation of these maps is more populated FSAs tend to be smaller than less populated FSAs, so the size of an FSA does not represent its importance). Alberta follows the general pattern of lower flood take-up in rural FSAs and higher flood take-up in urban FSAs more starkly than most provinces. Flood insurance take-up rates are high in Edmonton and even higher in Calgary, with some FSAs nearing or exceeding 90% take-up. Outside of these urban areas, few other FSAs exceed 40% take-up of flood insurance.

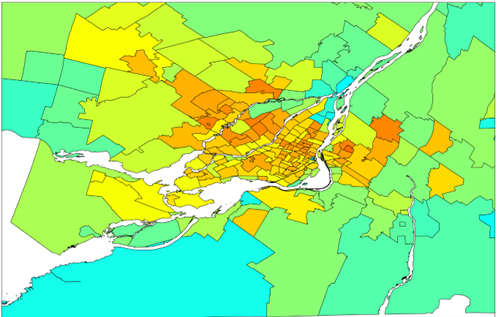
Ontario follows a similar pattern as Alberta (see Figure 3), although not quite as extreme. Rural FSAs tend to have lower take-up rates, but unlike Alberta, there are several rural Ontario FSAs with take-up in the 50% range. Ontario’s urban flood insurance take-up rate is still relatively high. Most of these FSAs are in the 60%-80% range, compared to Alberta’s 70%-90%.

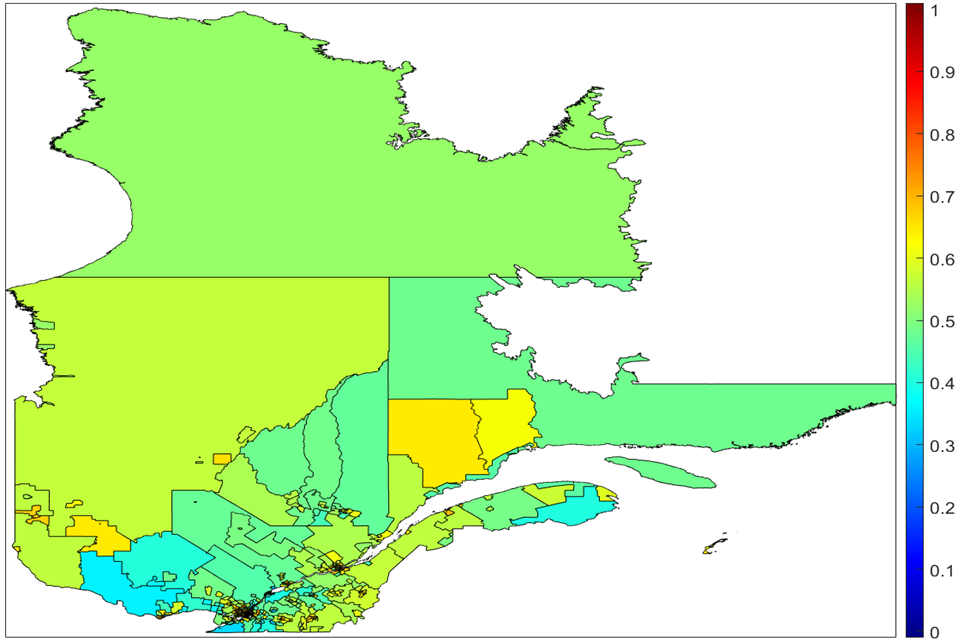
By contrast, British Columbia and Quebec has a more even spread of flood insurance take-up rates across FSAs (see Figure 2 and Figure 4). Urban FSAs in these two provinces still tend to have higher flood insurance take-up compared to rural FSAs, usually around 70%. Notably, the Richmond and Delta FSAs have relatively low take-up rates compared to other urban areas, and even Vancouver FSAs tend to have take-up rates in the 60%-70% range. On the other hand, B.C.’s rural FSAs tend to have relatively high take-up rates, with most in the 40%-60% range. Quebec’s rural FSAs have even higher take-up rates on average with take-up almost never dropping below 40%.

The growth in the take-up rate of flood insurance from 2018 to 2021 has also been highly uneven across Canada. Calgary, Edmonton, and Toronto were among regions that grew the most, with many of these FSAs growing around 30 percentage points. Some provinces, such as Alberta and Quebec, grew relatively evenly across the entire province. Other provinces, including British Columbia and Ontario, had mixed growth with some FSAs having almost no growth in the take-up of flood insurance. As FSAs with easier growth opportunities approach universal take-up of flood insurance, it may be interesting to examine how provinces like Alberta and Quebec have sustained broad-based growth in flood insurance take-up and consider whether these approaches can be effective in other provinces.

Figure 1: Alberta (top), Calgary (middle), and Edmonton (bottom) flood insurance take-up as fraction of fire, 2021, by value insured. Source: CatIQ/ICLR

Province-level view, Alberta. Source: CatIQ/ICLR
Zoom: Calgary. Source: CatIQ/ICLR
Zoom: Edmonton. Source: CatIQ/ICLR

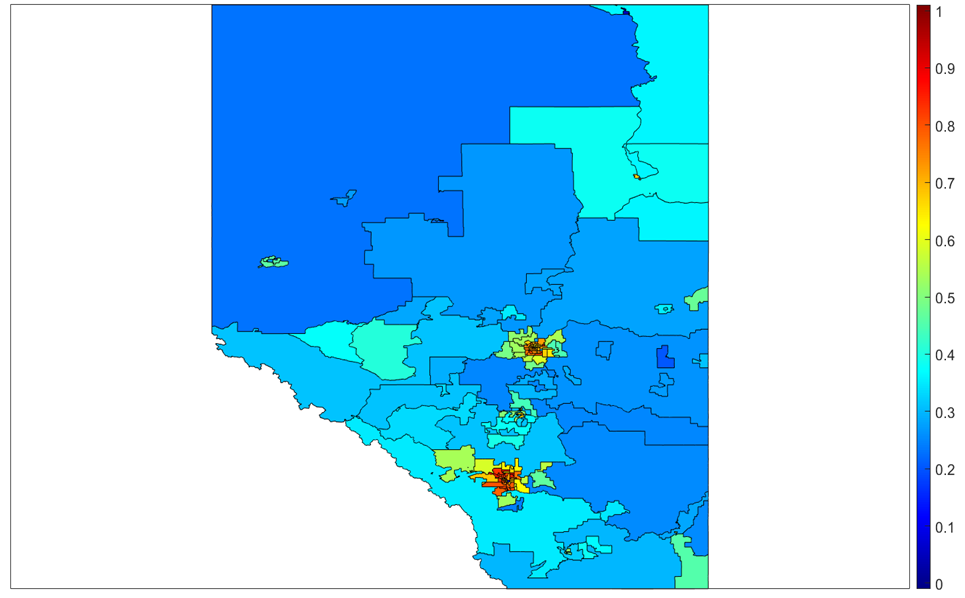
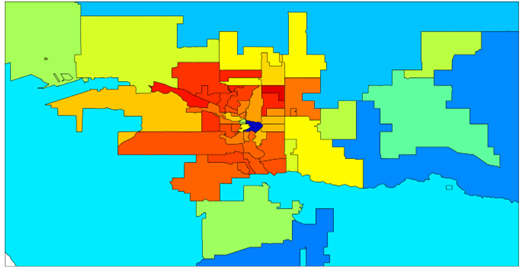
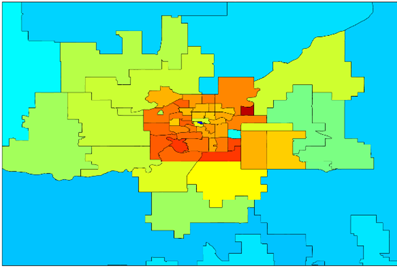
Figure 2: British Columbia (top), and Vancouver/Victoria region (bottom) flood insurance take-up as fraction of fire, 2021, by value insured. Source: CatIQ/ICLR

Province-level view, British Columbia. Source: CatIQ/ICLR
Zoom: Victoria – Vancouver. Source CatIQ/ICLR

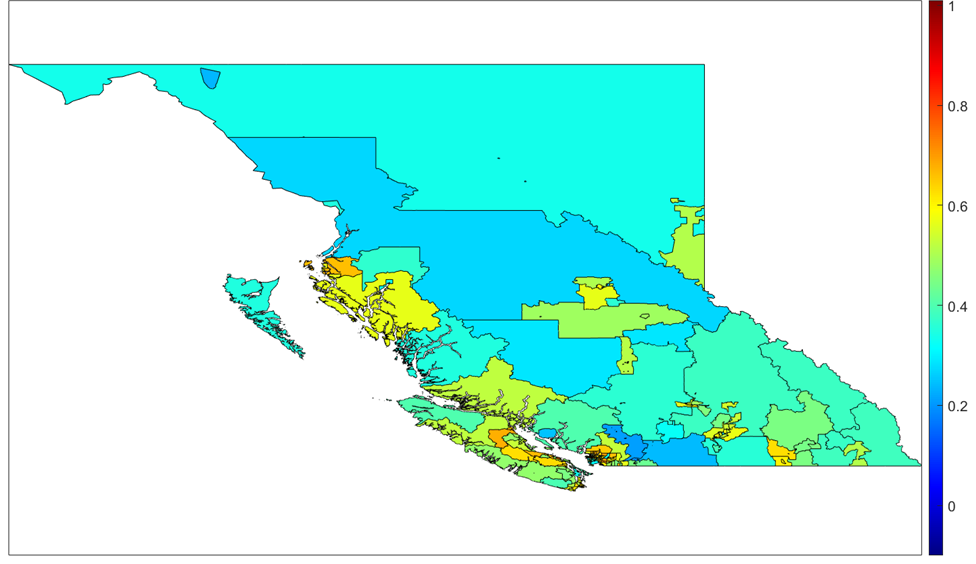
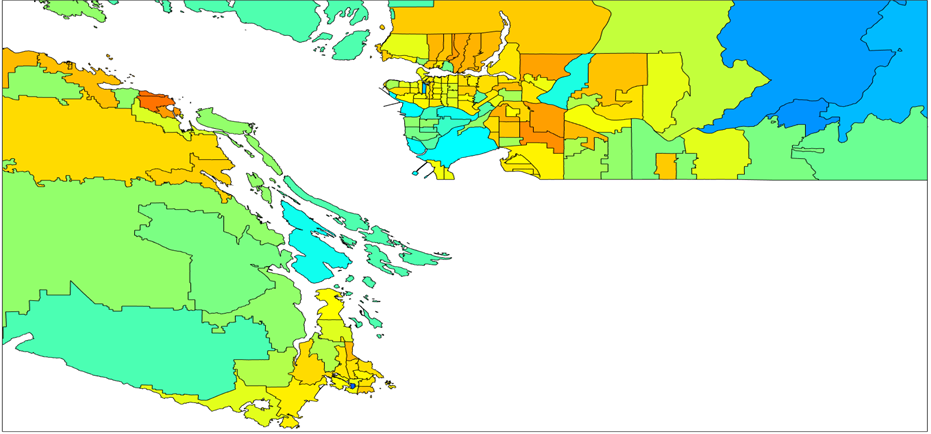
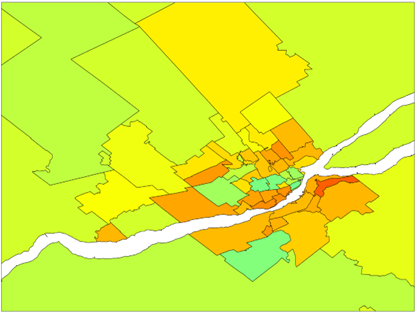
Figure 3: Ontario (top), Toronto (middle), and Ottawa/Gatineau (bottom) flood insurance take-up as fraction of fire, 2021, by value insured. Source: CatIQ/ICLR

Province-level view, Ontario. Source: CatIQ/ICLR
Zoom: Toronto. Source CatIQ/ICLR
Zoom: Ottawa/Gatineau. Source: CatIQ/ICLR

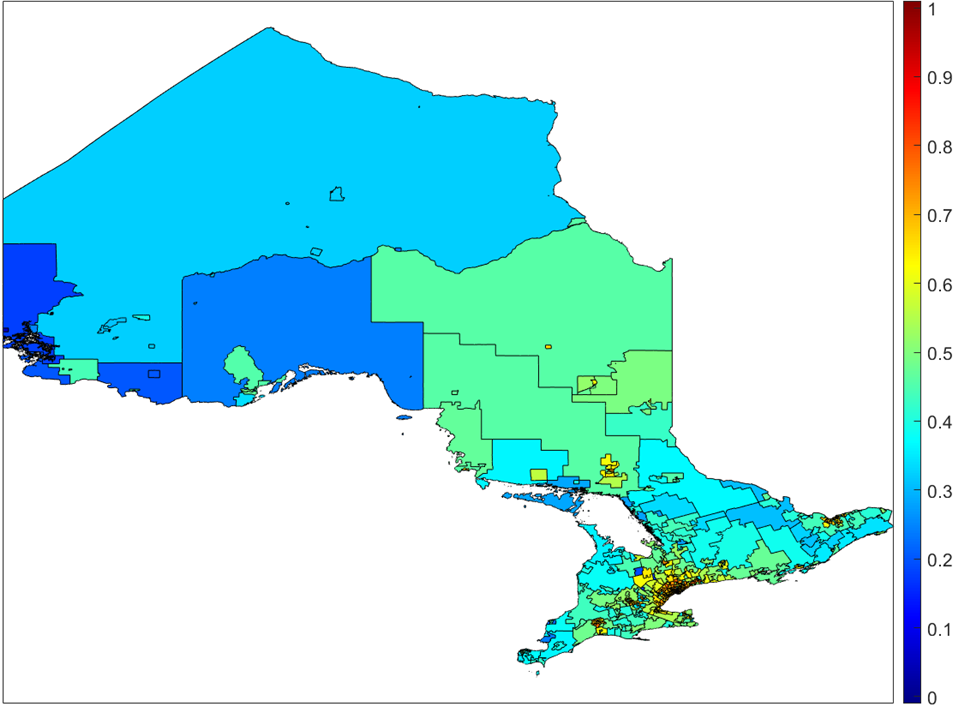
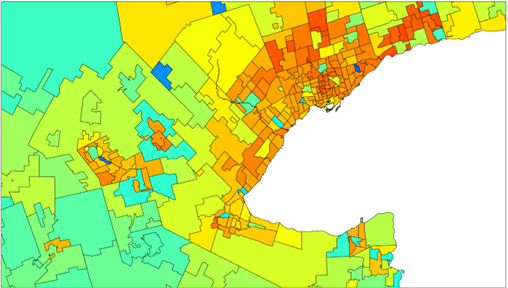
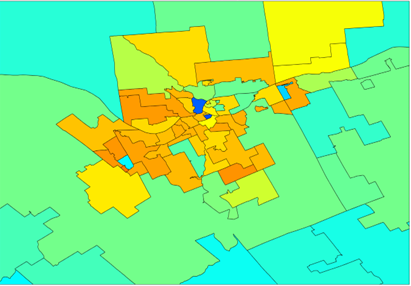
Figure 4: Quebec (top), Montreal (middle), and Quebec City (bottom) flood insurance take-up as fraction of fire, 2021, by value insured. Source: CatIQ and ICLR.

Province-level view, Quebec. Source: CatIQ/ICLR
Zoom: Montreal. Source: CatIQ/ICLR
Zoom: Quebec City. Source: CatIQ/ICLR

Risk Perception Floods the Risk Communication Scene

Here’s something you probably know from experience: your perceived risk of a threat can be very different from the actual risk of that threat. That we would sooner set foot in a car than a body of water home to the occasional shark is a case-in-point of our fundamentally flawed sense of risk perception.

Our faulty risk compasses by themselves aren’t the problem—risk perception is a pretty handy natural defense mechanism. What actually matters is the situations we analyze for risk, and how we respond in turn.

It’s impossible to constantly take stock of the complex risk environment associated with simply existing in the world. We’d only cause ourselves undue stress to fret over risks we can’t control; even experts can’t be expected to be completely prepared for catastrophic events like tsunamis and major oil spills.

To swim or not to swim...
To swim, or not to swim. Photo by Lubo Minar on Unsplash

It’s most pragmatic to concern ourselves with low-impact, high probability threats. These mundane threats are often eclipsed, however, by their high- impact, low probability counterparts. Think about the everyday wear-and-tear of exercise on your body—there’s a high probability of soreness or pulling a muscle, but the threat to our life is low. Still, the threat of a shark attack is more exciting to our brains than the risk of pulling a hamstring. Our risk compasses have a tendency to confuse north with south.

Water, Water Everywhere, and Not a Hint of Risk

In Canada, flooding is an example of a persistent, relatively low-level threat that most people don’t typically consider risky enough to merit preparation. In a 2020 survey by the applied flood risk research group Partners for Action, nearly half of the 2,500 Canadian homeowners living in a designated flood zone said that they were unconcerned about flooding, and just over half had not taken action to protect their property from flooding. Subsidized sump pump, anyone?

No matter what our risk perception may tell us, floods are actually the most common natural disaster in Canada. The Canadian Disaster Database reported 91 significant floods in the last two decades, which is close to half the total number of flood events that occurred in Canada in the entirety of the 20th century.

Along with the increased frequency of flooding is the cost to property-owners, insurers, and all levels of government. Flooding is largely to blame for the property and casualty insurance industry’s mounting catastrophic insurable losses each year. Catastrophic losses represent insured losses for a disaster that total $25 million or more, and they’ve risen steadily since the 1980s. In light of the financial burden of ever-more frequent and intense floods—including the devastating Alberta floods of 2013—the Harper government began to usher in an integrated approach to flood management to try to disperse the risks (and costs) among everyone involved in flood management. Historically, the onus of flood management rested almost exclusively on federal governments, who relied on physical control measures (think, dikes and dams) to manage floods. The new, risk-based approach relies less on structures and more on collaboration.

This means that federal disaster aid programmes have been winding down, and at the same time, the availability of private flood insurance and property-level flood protection measures, like residential flood risk assessment training courses and free how-to guides, have increased. Canadian homeowners and renters have become responsible for their own home flood protection and flood response in an unprecedented way.

Thinking about risk
A chronic hazard for many Canadians. Photo by billow926 on Unsplash

Flooding is a chronic hazard that many Canadian homeowners and renters pay for dearly—financially, physically, and emotionally—but residents aren’t acting on reducing their personal flood risk. It’s tempting to say that the solution to galvanizing action among the public is to spread information about flood risk widely, and then, armed with this knowledge, people might adopt risk-averse behaviours.

But maybe that’s naïve. To the exasperation of emergency managers and public officials everywhere, people can be told about all the dangers of a risk and still neglect to change their behaviour. It turns out that flood risk awareness is just one of the catalysts for acting on the very real risk flooding presents. Knowledge, access to resources, and risk perception all play a role in determining our flood-related actions (or lack thereof).

What Lies Between Perception and Action?

Risk perception is undoubtedly the most nebulous piece of the risk judgement-to-action puzzle.  Even though we know a bit about what determines flood risk perception—income, gender, age, and previous flood experience, to name a few—the problem lies in the gap between how people perceive their own personal flood risk, and the actual risk of flooding in their area. Closing the risk perception gap is difficult because, well, people are irrational.

According to psychology and behavioural economics professor Dr. Dan Ariely, humans are unequivocally irrational. Nevertheless, there is method to our madness.

“Why do we splurge on a lavish meal but cut coupons to save twenty-five cents on a can of soup?” muses Ariely in his 2008 book, Predictably Irrational: The Hidden Forces That Shape Our Decisions. “We consistently overpay, underestimate, and procrastinate. Yet these misguided behaviors are neither random nor senseless. They’re systematic and predictable—making us predictably irrational.”

People’s “predictable irrationality” has long been exploited for commercial purposes by advertisement companies, who are eerily good at preying upon consumers’ unconscious wants and desires. Beyond their commercial uses, our predictable patterns of behaviour can be used to more compassionate ends, such as motivating healthy behaviours through public health messaging.

A common behavioural intervention is reinforcement, which, for health risks, include ‘punishments’ that take the form of graphic warning labels on cigarette packaging to discourage smoking, or being denied entry into a public space without a face mask to reduce the spread of COVID-19. A positive reinforcement might be to ‘nudge’ consumers into healthy behaviours by placing healthy foods at the front of a store and unhealthy ones near the back.

So far, the evidence has shown that the science behind health risk interventions may be key in addressing how people perceive natural hazards, including floods. Protection motivation theory (PMT), a behavioural theory that explains how individuals make decisions about threats, actually has its origins in the field of health science.

More recently, PMT has been shown to accurately account for the risk perception mechanisms—like the role of income in determining flood risk perception and the likelihood of adopting flood risk-averse behaviours—of flood-prone homeowners in France, Germany and the United States.

Flood Risk Communication Awash in Behavioural Science

Theories like PMT help to explain the seemingly inexplicable differences in flood risk perception levels among specific demographic groups—for instance, the higher levels of flood risk perception among female-identifying homeowners and tenants shown in some research.

This is important: identifying gaps in risk perception based on social, economic and spatial factors could help to make flood risk communication to the public more consistent and targeted. In other words, the messaging around flood risk should resonate with the lived reality of the people experiencing the risk, otherwise, who cares?

There’s a compelling case for including risk perception in the design of educational initiatives and awareness campaigns. With advancements in flood risk research, we can adjust our methods of public engagement to promote flood-safe behaviours using the same science that backs tried and true methods to motivate behaviour change.

Imagining a Canadian society with accessible, effective messaging about flood risk looks something like this: flood risk information gracing the walls of public transportation stations everywhere, geo-targeted flood forecasting and warnings on social media, and dedicated home flood protection departments at essential businesses.

The messaging around flood risk should resonate with the lived reality of the people experiencing the risk.
Photo by Berkay Gumustekin on Unsplash

Communication efforts must be taken on by diverse groups of flood risk stakeholders. Academia, insurance companies, community groups, financial institutions and local politicians all have an important opportunity to engage with members of the public about flood risk. Canada is in the midst of a transition in flood management that calls on everyone to do their part. This requires widespread behaviour change by individuals—but first, we need to understand how and why people make decisions. Identifying risk perception strategies for changing behaviour might help do just that.

This article was prepared for CatIQ by Rachel Krueger, School of Environment, Enterprise and Development, University of Waterloo.

Categories

Flooded with new exposure

This article was first published in the Canadian Underwriter Dec 2019 Magazine where Canadian Underwriter interviewed Laura Twidle, Managing Director at CatIQ.

cu | Is it possible that over the long term, Canada’s P&C industry will be paying $2 billion annually to insure catastrophe damage? Yes, it’s certainly possible. There has been an upward trend of Cat losses and the industry has been increasing its exposure to flood and water. Of course, we have the large events like the Fort McMurray wildfire and the Alberta floods that could be considered to skew the timeline; but in 2018, there was no $1-billion event, and yet Cat losses were still greater than $2-billion. We are comfortably crossing the $1-billion mark every year, and have already done this in 2019. It wouldn’t surprise us to see an average $2 billion annually within the next few years.

cu | You mentioned the industry increased its exposure to water damage when it started offering overland flood coverage in 2015. How does this play out in the Cat loss numbers? Since 2015, the percentage of Cat losses related to water has increased. In some years, this has been nearly a quarter of the annual loss.

cu | To what extent is climate change a factor in all this? In addition to the industry becoming more exposed to flooding, we’ve seen a lot more water-related events come into the picture over the past few years. Cat season was always defined as the summer due to severe thunderstorms in the Prairies, with hail and strong wind gusts bearing through in Western Canada. But since 2017, Ontario and Quebec have dominated the Cat losses. This year, we had five catastrophes in the first quarter, and the decadal average is one. Four out of five of these first-quarter Cats were mainly water-related; Greater Toronto Area (GTA) bore the brunt of these events. Several intermittent warm-ups with rainfall in the cold season resulted in seepage, ice damming, sewer backups, ice jams and overland flooding. With Canada experiencing a significant rate of warming, particularly in the winter, an active first quarter could become the norm and not just impact the GTA.

cu | Which part of the year is typically the worst for catastrophes? That’s been changing. Historically, what we’ve called Cat season is the third quarter, since July is typically when we see the most Cats and the most loss, mainly a result of severe thunderstorms in the Prairies. In 2018, we had more Cats in the third quarter, but the second quarter was more impactful due to loss mainly because of the May windstorm in Ontario and Quebec. This year, the first quarter was unusual. It was more impactful than the third quarter; if we include the April flooding in eastern Canada, the losses were significantly higher. Because of the spring Cats in Ontario and Quebec, we are seeing a shift in the timing of the peak for losses and events. One concern would be that the third quarter returns to being the peak Cat season, while the first and second quarters continue to experience significant Cat loss.

cu | What are the most common types of Cat claims? Cat claims relating to physical damage are more common than non-physical claims such as business interruption and additional living expenses. Regarding specific types of damage reports, claims relating to sewer backups, seepage, and wind damage — downed trees, torn shingles and siding, for example — occur year-round.

cu | Where in Canada are you most likely to see the most damaging Cat losses? Insured catastrophes happen where people are, so it’s heavily biased towards densely populated areas like the GTA. Atlantic Canada gets walloped with intense weather-systems frequently in the winter, and hurricanes in the fall, but from a Cat loss perspective, the area is less densely populated, and generally equipped to handle such storms. However, this is not always the case, as we saw from the damage caused by Hurricane Dorian this past September. In the interior of Canada, just off the foothills of Alberta, severe thunderstorms will always develop there. All you need is some atmospheric instability and easterly winds at the surface, and you have yourself a thunderstorm. If there is enough upper-level support in the atmosphere and wind shear, the storm might become severe and sustained to reach the highway that runs between Calgary and Edmonton. A significant portion of Alberta’s population lives along that corridor, and so that area will always be susceptible to severe thunderstorms that produce large hail, and damaging wind gusts and therefore Cat loss.

cu | Tell us a bit about the CatIQ Connect conference coming up in Toronto on Feb. 3-5, 2020. I understand you are taking a bit of a different approach to this conference. How so? CatIQ Connect is the annual Canadian Cat conference that brings together experts from the industry, all levels of government and academia to discuss best practices and innovative solutions to mitigating loss to Cats. The theme next February will be a solutions-based approach to Cats. We have already talked a great deal about the challenges that come from Cats. What we really want to do at CatIQ Connect 2020 is to say: ‘We all know this problem exists, and here is a potential solution,’ or ‘Here is the next step to mitigating catastrophic loss.’ Our steering committee has put together a great agenda featuring outstanding speakers. The 2020 keynotes include Roy Wright, president and CEO from the Insurance Institute for Business & Home Safety. We’ll have a fireside chat with Maryam Golnaraghi, director of climate change and emerging environmental topics of the Geneva Association. And we’ll hear from Kathy Bardswick, president and CEO of the Canadian Institute for Climate Choices. On the first day, we will host a workshop in partnership with the Canadian Red Cross. The next two days include jam-packed information sessions around many topics — flooding, earthquake, wildfire, mental health in disasters, from the on the ground perspective, financial solutions to climate change, resiliency, communication, and risk assessments.

IMPROVING WILDFIRE AND FLOOD RISK MITIGATION IN CANADA

Improving Wildfire and Flood Risk Mitigation in Canada

Author: Alan Frith, CPCU, ARe, CEEM

Canadians have suffered an increasing number of natural and man-made disasters that have devastated communities and cost insurers more than CAD 5 billion in 2016 alone. With decentralized regulation and prevention efforts, the growing financial fallout is only likely to worsen. CatIQ’s Canadian Catastrophe Conference, January 31 – February 3, 2018, will bring together industry, academia, and government to discuss Canada’s natural and man-made catastrophes. I will be sitting on a panel discussing the viability of the Alberta property insurance market in light of recent catastrophic events.

For insurers, an accurate and objective view of risk, reinforced by an up-to-date insight into the exposure, is crucial to maintaining financial stability. Managing catastrophe risk through historical losses alone is unreliable and volatile. Organizations must seek out the most comprehensive information available to understand how rapidly changing environmental characteristics alter their risk profiles.

Let’s examine two of the perils that have recently caused significant losses in Canada to understand how risk assessment tools can be used to quantify the impact of these kinds of events.

Wildfire

High-resolution satellite imagery enables us to develop an in-depth understanding of land use/land cover and is a critical piece of the risk mitigation framework. Using this imagery, risk modelers can construct an accurate map of potential fuel sources, a fundamental requirement for effectively modeling wildfire spread. Dense or dry vegetation, for instance, allows a fire to spread easily, while roads, rivers, or even mountains serve as natural firebreaks. Depending on the local distribution of fuel sources, the interaction between different types of fuels, and the gradual evolution of the surrounding landscape, your portfolio’s exposure may very well outpace your organization’s risk appetite over time.

It’s also important to monitor the effect of population movement. Rapid residential and commercial/industrial growth deeper into areas of combustible fuel, the Wildland Urban Interface (WUI),  exposes properties to greater wildfire risk. For organizations underwriting property risk in Canada, one fire in recent memory certainly stands out from the rest, demonstrating well the dangers of increased development in the WUI.

In 2016, the Fort McMurray fire blazed through the surrounding areas of northeastern Alberta, causing unprecedented devastation and destroying up to 80% of homes in some neighborhoods. A hub of oil production in Canada, the town had experienced a 30% population boom between 2006 and 2011 as people moved to the area to take advantage of job opportunities at the many mines and oil sands refineries in the area. The increased presence of residential structures among dense forest helped the flames spread quickly and resulted in insured losses of nearly CAD 4 billion – making it the costliest natural disaster in Canadian history. Although the oil facilities and pipelines themselves avoided damage, oil companies suffered significant business interruption losses as firefighters struggled for months to contain and extinguish the fires.

Flood

Detailed satellite imagery, coupled with high-resolution elevation data in the form of digital terrain maps (DTMs), is also used to build floodplain maps, which play an important role in evaluating flood risk. Reliable model output for this peril is highly dependent on precise exposure locations, as small changes to a location’s elevation or proximity to floodplains can have a significant impact on potential losses. The development of risk mitigation strategies, such as strict building codes and zoning laws, can help prevent these losses, so long as these codes are followed and the laws are enforced. Government agencies must consider the effect that unchecked commercial development—and the associated infrastructure of roads, sidewalks, and parking lots—can have on the larger ecosystem, especially during a natural disaster. The consequences of unregulated urban sprawl were recently seen in Houston, Texas, during Hurricane Harvey: Severe flooding was caused in part by floodwater that had inadequate access to natural drainage, such as undeveloped prairie and marshland areas.

Although flood is by far the most frequent natural disaster in Canada, preventive efforts are largely decentralized. For residential structures, overland flood damage has only recently been included as a covered peril by private insurance. In many cases, it’s a common exclusion from homeowners’ policies, with catastrophic losses ultimately falling in taxpayers’ laps via government emergency funds. With multiple catastrophic flood events in the past seven years, each causing billions of dollars of losses, it’s imperative to mitigate risk through preventive measures. This includes building flood defense systems as well as encouraging homeowners in and around potential flood zones to purchase policies that protect them against flood loss.

What’s Next?

Governments, insurers, and homeowners need to work together to reduce losses caused by natural disasters. It’s encouraging to see mitigation efforts gaining momentum, but there is much more work to be done. While government can manage building codes and zoning laws, it’s also up to insurers to carefully evaluate their risk profiles and exposures to ensure that they continue to maintain adequate reserves in the event of a catastrophe.

A useful first step in risk assessment is a detailed hazard map. These maps indicate the associated risks for perils such as wildfire and inland flood for a range of return periods, such as 100, 250, and 500 years. The logical next step to advance your risk evaluation strategy is to use a probabilistic model.  These models use advanced simulation methods to provide valuable metrics such as Average Annual Loss (AAL), Tail Value at Risk (TVaR) and a full Exceedance Probability (EP) Curve, from portfolio level down to individual exposures.

The Geospatial Analytics Module in AIR’s Touchstone® platform lets you seamlessly integrate exposure information with location-specific hazard maps, including wildfire fuel layers and flood inundation footprints for Canada. In addition, AIR offers probabilistic models for earthquake, crop hail, severe thunderstorm, winter storm, and tropical cyclone in Canada; models for wildfire and flood are being developed. As the insurance industry in Canada continues to cope with recent losses, the development of risk maps and probabilistic models as well as a deeper understanding of underlying hazards can help provide more effective risk management.

AIR models give you the information you need to support your entire risk-decision chain. Learn about the AIR Model Advantage!

About AIR Worldwide

AIR Worldwide (AIR) provides risk modeling solutions that make individuals, businesses, and society more resilient to extreme events. In 1987, AIR Worldwide founded the catastrophe modeling industry and today models the risk from natural catastrophes, terrorism, pandemics, casualty catastrophes, and cyber attacks, globally. Insurance, reinsurance, financial, corporate, and government clients rely on AIR’s advanced science, software, and consulting services for catastrophe risk management, insurance-linked securities, site-specific engineering analyses, and agricultural risk management. AIR Worldwide, a Verisk (Nasdaq:VRSK) business, is headquartered in Boston with additional offices in North America, Europe, and Asia. For more information, please visit www.air-worldwide.com.