Despite its long history of wildfires, Canada still doesn’t know how to live with them

In the fall of 1922, the city of Toronto sent 85 surplus streetcars to Haileybury and other northern Ontario towns to help house thousands of desperate people who had lost their homes to wildfires.

Known as the Great Fire, it burned nearly 1,700 square kilometres of the area — including the town of Haileybury. It killed 43 people and caused millions of dollars in property damage in 18 townships. A newspaper referred to it as the “worst disaster that had ever overtaken northern Ontario.”

It was not.

The wildfires back then were as fierce, deadly and eerily similar to the ones we have today. And we have yet to learn to live with them.

Fires of the past

The Great Miramichi fire, which destroyed forests and devastated communities across northern New Brunswick in 1825, was the largest and one of the most deadly wildfires in North American history.

The Saguenay and Ottawa Valley fires in 1870 could have been just as deadly when they forced the evacuations of several thousand people. The capital city would have burned down that summer had it not been for a quick-thinking engineer who ordered the gates of the St. Louis dam on the Rideau Canal to be breached so that it would flood city streets.

Seventeen villages were levelled in Wisconsin the following year, killing between 1,200 and 1,500 people.

In 1881, the Michigan’s Thumb fires burned 1,480 barns, 1,521 houses and 51 schools, while killing 283 people and injuring many others. Smoke from those fires coloured the sky over Toronto.

In 1908, the British Columbia town of Fernie was levelled by a wildfire. In 1911, the Porcupine fire killed 73 people while levelling the towns of South Porcupine and Pottsville in Ontario before partially destroying Golden City and Porquis Junction.

There was almost no warning five years later when a deadlier complex of fires swept through the same region and killed 223 people.

Each summer and fall, it seemed, ended badly somewhere.

Déjà vu

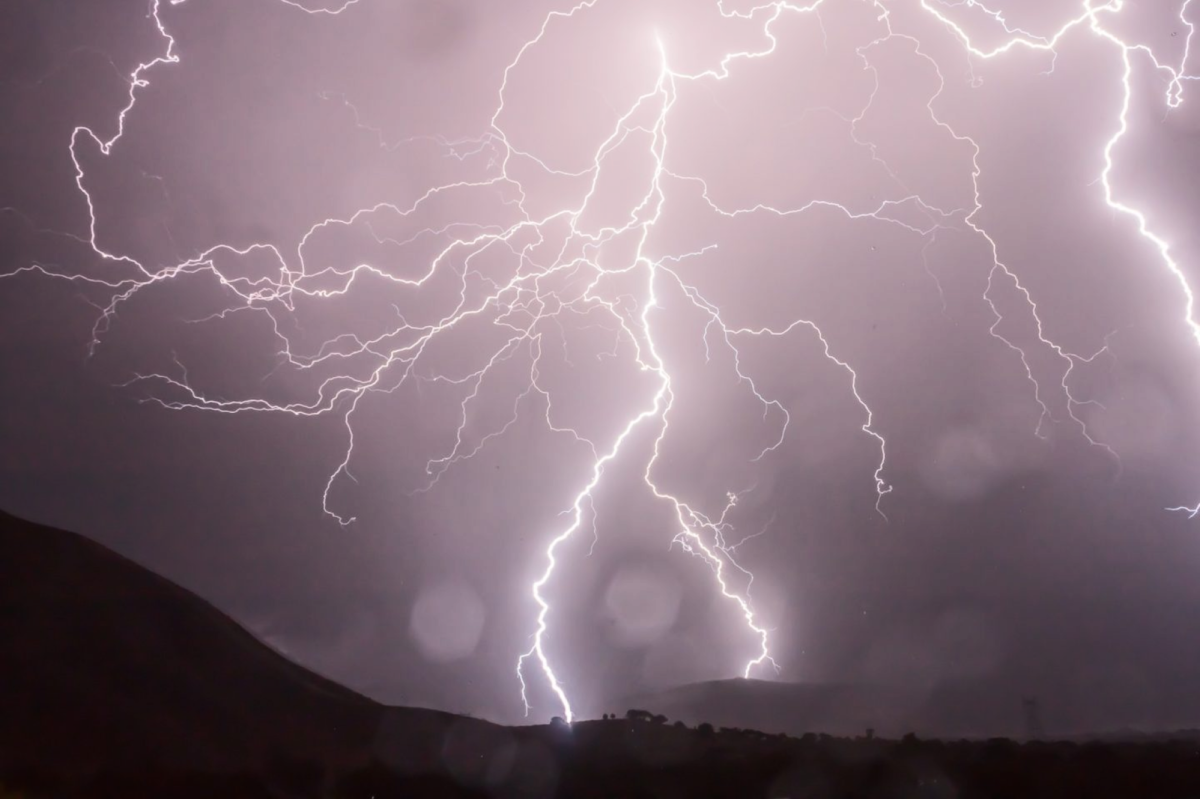
The similarities between the fires now and then are uncanny, as described in my book Dark Days At Noon: The Future of Fire. The ignition of fires between 1870 and 1922 was fuelled by higher temperatures, drier forests and the kind of elevated lightning activity that we are experiencing today.

Much of the warming back then can be attributed to the end of the little ice age (1300 to 1850) that dramatically cooled parts of the world, and the Industrial Revolution in the late 18th and early 19th centuries.

Today, the unprecedented warming taking place is primarily because of the burning of fossil fuels.

Forest land-grabbing and negligence has also fuelled numerous fires in the past and present.

Before and beyond the turn of the 19th century, people moved into boreal and temperate forests to take advantage of cheap land and jobs in the mining and forestry sectors. Today, people are building luxurious country homes in places like the Okanagan to escape the cost of living in big cities.

Sparks from trains and the careless disposal of locomotive ash accounted for a significant number of fires in Ontario in the past. Following the Lytton fire in B.C. in 2021, the head of Canada’s Transportation Safety Board acknowledged that more work is still needed to prevent wildfires caused by trains.

Gaps in public policy

The other thing that hasn’t changed much is public policy. The Porcupine fire in 1911 as Canada’s version of the Big Burn, a complex of fires that swept through the northern Rockies of the United States in 1910 and resulted in sweeping policy changes.

A black and white image of a mountain on fire
The destruction caused by the Big Burn of 1910 pushed the U.S. to revamp its wildfire management strategy. (Forest Service Northern Region/flickr), CC BY

Following the Big Burn, the U.S. passed the Weeks Act that authorized the government to purchase up to 30 million hectares of land to protect watersheds from development and wildfire. This mandated the U.S. Forest Service to work with state fire bureaus, which were happy to co-operate because it came with funding they could not otherwise afford.

In contrast, Canadian politicians failed to do what was necessary to prevent future fires. The government, which owned many of the railroad companies, blamed Indigenous people for many fires. Better legislation and fire management strategies were still not in place five years after the Porcupine fire when the Matheson fire took the lives of 223 people. Nor were they there in 1922, when the Great Fire devastated Haileybury.

Canada had a chance to replicate what the U.S. Forest Service was doing, but failed to as funding for fire research and management was badly decimated by budget cuts and the off-loading of responsibilities to the provinces in the 1930s.

Even today, provinces like Alberta have cut wildfire budgets to save money, only to pay the price when wildfires like the 2016 Fort McMurray wildfire, which forced the evacuation of 88,000 people.

Managing future fires

The fact that fire is still entering towns like Lytton and Fort McMurray without adequate warning suggests we have yet to learn to live with the fires that we have stoked by burning fossil fuels, draining wetlands and suppressing natural fires that would have otherwise produced more resilient forests.

Stopping Indigenous burning that aided forest regeneration didn’t help.

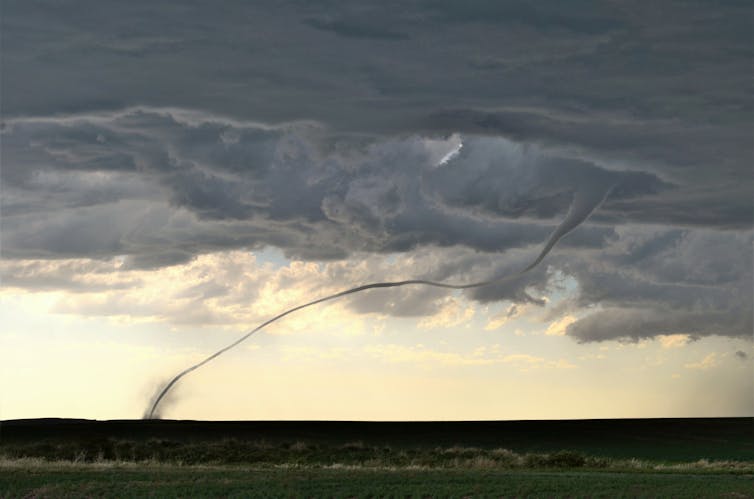
We are now in a unique situation where hot fires are creating their own weather — fire-driven thunderstorms and pyrogenetic tornadoes — that can spawn other fires. We saw this in Fort McMurray in 2016, in B.C. in the following years and in 2019 and 2020 when Australia’s Black Summer fire season led to a massive outbreak of fire-induced and smoke-infused thunderstorms.

This is, in a word, scary.

The title of my book Dark Days at Noon harkens back to 1780 when smoke from distant fires blocked out so much sunlight that people from all over New England thought the end of the world was at hand. The end of the world is not at hand, but there will be many more dark days at noon if we do not learn to live with fire.

Edward Struzik, Fellow, Queen’s Institute for Energy and Environmental Policy, School of Policy Studies, Queen’s University, Ontario

This article is republished from The Conversation under a Creative Commons license. Read the original article.

Canada is witnessing more thunderstorm impacts than ever before

Gregory Kopp, Western University; David Sills, Western University, and Julian Brimelow, Western University

Residents in eastern Ontario are still recovering after a tornado-producing thunderstorm left a path of destruction over 55 kilometres long and up to 1,400 metres wide in July.

Such thunderstorms, and the damage they leave behind, can have deep and far-reaching impacts on society and the economy, and they are only increasing.

In Canada, the new normal for yearly insured catastrophic losses has reached $2 billion — a significant increase from the $422 million per year between 1983 and 2008 — and a significant chunk of that is from thunderstorm-related severe and extreme weather.

We at the Northern Tornadoes Project and the recently launched offshoot — The Northern Hail Project — are often asked whether these severe and extreme weather events are on the rise, and if this has anything to do with manmade climate change? The simple answer is: it’s complicated.

The difference between severe and extreme

Severe thunderstorms occur in Canada every year, bringing with them large hail, damaging downburst winds, intense rainfall and tornadoes. More rare and of even greater concern are extreme weather events — with their size, intensity or even time of year well beyond what is typically expected based on past observations.

Long, thin tornado from thunderstorm base to ground
Prairie tornado in D’Arcy, Sask. on June 15, 2021. (David Sills), Author provided

Extreme weather conditions include tornadoes causing damage rated EF3-EF5 and significant hail of over five centimetres in diameter. Extreme weather can also arise when large hail accompanies downburst winds — increasing the hailstone impact energy — or when a long-lived thunderstorm system results in a derecho, which is a cluster of downbursts (and sometimes embedded tornadoes) resulting in intense damage over hundreds of kilometres.

In September 2018, for example, a tornado outbreak in the National Capital Region caused catastrophic damage resulting in over $300 million in insured losses. It is also the latest in the year that a tornado outbreak with up to EF3 damage has been recorded in Canada.

In June 2020, Calgary experienced Canada’s first billion-dollar hailstorm and fourth costliest natural disaster on record, with insured losses of $1.3 billion. The derecho in May 2022 that mainly affected southern Ontario took 12 lives, with early estimates of insured losses close to $900 million. And that’s just over the last four years.

How can we detect these trends?

Such events and their impacts cannot be adequately assessed and documented using standard operational weather observation platforms such as radar and surface weather stations.

Tornado tracks and hailswaths are inherently narrow and often pass between stations. Radar can capture some of the key meteorology, but not the impacts on the ground.

Comprehensive storm surveys by weather and engineering experts are required to fully assess and document the meteorology and its physical impacts through what we call an “event-based approach”. In fact, we recently added a social science component to such investigations to better capture the impacts on people and communities. The living database that results from these storm surveys can always be updated as new information is discovered.

Map depicting a 2017 tornado outbreak in Québec
A map shows the starting locations and tracks of the 23 tornadoes that occurred during a two-day tornado outbreak in Québec in June 2017. (Lesley Elliott and Liz Sutherland/The Northern Tornadoes Project), Author provided

This approach allowed the Northern Tornadoes Project to uncover one of the largest recorded tornado outbreaks in Canadian history — 23 tornadoes over two days in Québec — and increase the number of tornadoes documented across Canada each year. It has also allowed the new Northern Hail Project to recover and document Canada’s largest hailstone on Aug. 1, 2022.

The greater the length and better the quality of a national database of these events, the more likely it is that any severe and extreme storm trends will be detected.

Some progress has been made

The tornado data for Southern Ontario is of sufficient length and quality to allow us to begin to look for trends. A 2022 study found that the annual number of tornadoes recorded there since 1875 has grown substantially. But that is mainly due to an increase in weak tornadoes — ones that might have gone unreported in the past but now fail to escape the attention of the expanding population with consumer-grade cameras at the ready and access to social media for sharing.

The same study found, however, that tornadoes rated F/EF2+ in southern Ontario occurred gradually later in the year since 1875, now peaking in late summer rather than early summer.

Meanwhile, in the U.S., studies have shown that tornadoes may be occurring in bigger clusters and starting to shift eastward – away from the Great Plains and into more populated areas.

In all cases, clear connections to man-made climate change have not yet been established. It is also yet unknown whether extreme storms are changing in ways that are different from severe storms. But it’s still early and research in this area is growing rapidly.

While storm trends are studied, prepare for increased impacts

Canadians are recording and sharing images and experiences of severe and extreme storms more than ever before, increasing the documentation of these events. As the population continues to grow and spread out, the damage and losses caused by thunderstorms will continue to grow.

Damaged cars are seen next to the remains of houses damaged by a tornado.
Damage from an EF2 tornado in Barrie, Ont. on July 15, 2021. (Northern Tornadoes Project), Author provided

At the same time, we are learning more about changing storm patterns and possible connections to climate change. Continuing to increase the length and quality of our national severe and extreme storm event database is needed to better understand such changes.

In the meantime, developing adaptation strategies to ensure resiliency and to lessen the impact of inevitable damaging storms is becoming increasingly important. Improving upon building codes and other policies to promote more resilient buildings and communities is urgently needed to better protect the lives and property of Canadians.

Gregory Kopp, Professor of Civil Engineering & ImpactWX Chair of Severe Storms Engineering, Western University; David Sills, Executive Director – Northern Tornadoes Project, Western University, and Julian Brimelow, Executive Director Northern Hail Project, Western University

This article is republished from The Conversation under a Creative Commons license. Read the original article.

Flood insurance take-up in Canada, 2021

In this article, we examine trends in overland flood insurance take-up across Canada based on the 2021 CatIQ exposure data release. Flood-related events have caused over $5.5 billion in insured losses in Canada from 2012-2021. With climate change, losses to flood in Canada are expected to increase. Flood insurance can be an important tool to finance these losses if it is adopted widely across Canada. While overland flood insurance coverage for personal homes was introduced in Canada in 2015, its addition as a rider to insurance policies is optional and take-up varies dramatically across the country and over time.

We track personal flood insurance take-up in CatIQ data as a fraction of personal fire insurance take-up. In Canada, flood insurance exists as an additional endorsement to a homeowner’s or tenant’s insurance policy. We consider take-up both by number of policies (dividing number of flood insurance policies by fire insurance policies) and by value of insured property (dividing sum of buildings and contents covered by flood insurance policies by the same for fire insurance policies). These numbers tend to be similar; when take-up by the value of policies exceeds take-up by number of policies, it suggests more valuable assets are more likely to be insured for flood. Please note this metric should not be interpreted as the overall penetration of flood insurance in a region since not all homeowners and tenants have insurance.

Flood insurance take-up rates have grown steadily over time in Canada. In 2016, the first year of data available in CatIQ and one year following its introduction, flood insurance take-up rates were roughly 25% of that of fire insurance. Flood insurance take-up grew steadily to just under 40% by 2018. In 2021, the latest data release, roughly 55% of personal insurance policies have flood insurance. However, flood insurance take-up is still low across many parts of the country. Tables 1 and 2 show the personal flood insurance take-up rates as a fraction of fire insurance by number of policies and by value, respectively, across the provinces of Canada. There is significant variation in flood insurance take-up rates across the provinces. Manitoba had the lowest flood insurance take-up rates in Canada, with the next-lowest province having almost double the flood insurance take-up rates. By contrast, Alberta, British Columbia, Nova Scotia, Ontario, and Quebec had over half of personal lines with flood insurance coverage in 2021.

Table 1. Flood insurance take-up as fraction of fire insurance, by number of policies

 CANABBCMBNBNLNSONPEQCSK
201838%27%39%11%28%26%27%40%17%45%31%
202154%53%55%20%42%38%54%57%37%57%42%
Source: CatIQ and ICLR

Table 2. Flood insurance take-up as fraction of fire insurance, by value insured

 CANABBCMBNBNLNSONPEQCSK
201839%30%45%10%31%32%31%42%21%42%30%
202155%59%53%19%41%46%54%58%38%58%41%
Source: CatIQ and ICLR

The territories of Northwest Territories, Nunavut, and Yukon have flood insurance take-up rates very similar to those of the rest of Canada in 2021. As a fraction of total values insured, they were 43%, 58%, and 43% respectively. The rate of growth of flood insurance take-up over the past 3 years was much higher in the territories. Flood insurance take-up averaged below 5% of fire insurance take-up in the territories in 2018.

Flood take-up rates within provinces vary dramatically across Forward Sortation Areas (FSAs), or 3-digit postal codes. Generally, flood insurance take-up rates were higher in metropolitan FSAs compared to rural FSAs. In the denser metropolitan FSAs, flood insurance take-up rates often exceed 70% of the fire insurance take-up rates. Some FSAs even see 80% or 90% take-up of flood insurance. In contrast, rural FSAs rarely exceed 60% take-up of flood insurance even in provinces with higher take-up rates.

Figure 1 maps Alberta’s flood insurance take-up by FSA, along with a zoomed-in look at the denser Calgary and Edmonton metropolitan areas (an unfortunate limitation of these maps is more populated FSAs tend to be smaller than less populated FSAs, so the size of an FSA does not represent its importance). Alberta follows the general pattern of lower flood take-up in rural FSAs and higher flood take-up in urban FSAs more starkly than most provinces. Flood insurance take-up rates are high in Edmonton and even higher in Calgary, with some FSAs nearing or exceeding 90% take-up. Outside of these urban areas, few other FSAs exceed 40% take-up of flood insurance.

Ontario follows a similar pattern as Alberta (see Figure 3), although not quite as extreme. Rural FSAs tend to have lower take-up rates, but unlike Alberta, there are several rural Ontario FSAs with take-up in the 50% range. Ontario’s urban flood insurance take-up rate is still relatively high. Most of these FSAs are in the 60%-80% range, compared to Alberta’s 70%-90%.

By contrast, British Columbia and Quebec has a more even spread of flood insurance take-up rates across FSAs (see Figure 2 and Figure 4). Urban FSAs in these two provinces still tend to have higher flood insurance take-up compared to rural FSAs, usually around 70%. Notably, the Richmond and Delta FSAs have relatively low take-up rates compared to other urban areas, and even Vancouver FSAs tend to have take-up rates in the 60%-70% range. On the other hand, B.C.’s rural FSAs tend to have relatively high take-up rates, with most in the 40%-60% range. Quebec’s rural FSAs have even higher take-up rates on average with take-up almost never dropping below 40%.

The growth in the take-up rate of flood insurance from 2018 to 2021 has also been highly uneven across Canada. Calgary, Edmonton, and Toronto were among regions that grew the most, with many of these FSAs growing around 30 percentage points. Some provinces, such as Alberta and Quebec, grew relatively evenly across the entire province. Other provinces, including British Columbia and Ontario, had mixed growth with some FSAs having almost no growth in the take-up of flood insurance. As FSAs with easier growth opportunities approach universal take-up of flood insurance, it may be interesting to examine how provinces like Alberta and Quebec have sustained broad-based growth in flood insurance take-up and consider whether these approaches can be effective in other provinces.

Figure 1: Alberta (top), Calgary (middle), and Edmonton (bottom) flood insurance take-up as fraction of fire, 2021, by value insured. Source: CatIQ/ICLR

Province-level view, Alberta. Source: CatIQ/ICLR
Zoom: Calgary. Source: CatIQ/ICLR
Zoom: Edmonton. Source: CatIQ/ICLR

Figure 2: British Columbia (top), and Vancouver/Victoria region (bottom) flood insurance take-up as fraction of fire, 2021, by value insured. Source: CatIQ/ICLR

Province-level view, British Columbia. Source: CatIQ/ICLR
Zoom: Victoria – Vancouver. Source CatIQ/ICLR

Figure 3: Ontario (top), Toronto (middle), and Ottawa/Gatineau (bottom) flood insurance take-up as fraction of fire, 2021, by value insured. Source: CatIQ/ICLR

Province-level view, Ontario. Source: CatIQ/ICLR
Zoom: Toronto. Source CatIQ/ICLR
Zoom: Ottawa/Gatineau. Source: CatIQ/ICLR

Figure 4: Quebec (top), Montreal (middle), and Quebec City (bottom) flood insurance take-up as fraction of fire, 2021, by value insured. Source: CatIQ and ICLR.

Province-level view, Quebec. Source: CatIQ/ICLR
Zoom: Montreal. Source: CatIQ/ICLR
Zoom: Quebec City. Source: CatIQ/ICLR

The cheaper we build our buildings, the more they cost after an earthquake, wildfire or tornado

Keith Porter, Western University

A tornado cut a 270-kilometre path through Kentucky in mid-December 2021, killing 80 people, many in their homes or workplaces, and rendering thousands homeless. The incident prompted David Prevatt, a professor of structural engineering at the University of Florida, to write an opinion piece for the Washington Post, reminding Americans that new buildings could be tornado proof, but are not.

We are learning similar truths in Canada. Barrie, Ont., struck by a set of tornadoes on July 15, 2021, is still recovering. So too, are those who survived the fires in Fort McMurray, Alta., in 2016, and in Lytton, B.C., in June 2021. It’s the same story following the floods in British Columbia in November 2021 and the derecho that struck Southwestern Ontario in late May, lifting roofs off some buildings and destroying others.

Engineers, architects and builders can design and construct affordable new buildings that can resist tornadoes, floods and wildfires without making the buildings into bunkers. We could also design earthquake-resilient buildings, but do not.

I am a structural engineer and an expert in performance-based engineering and catastrophe risk management. I believe the only way to make that happen is to require our building code to minimize society’s total cost to own new buildings. We have always been free to make that happen, but have a rare window now to shape that future, as the nation and code developers urgently respond to the climate crisis.

Why don’t we build resilient buildings?

Building-code writers, engineers and others frequently tout the benefits of modern building codes. But new buildings only keep us relatively safe; they’re not disaster proof. Why don’t we build better buildings? Because it would cost a little more.

We build to minimize initial construction costs while maintaining a reasonable degree of safety and avoiding damage where practical, a strategy known as “least-first-cost” construction. We save a small amount on initial construction costs and call the savings “affordability.”

But that kind of affordability is an illusion, like a tantalizingly low sticker price on a flimsy car. Wise car buyers know that the low cost is just the beginning of a series of bills.

In new construction, every dollar saved weaves in $4 or more of future costs to pay for unpredictable catastrophes: severe storms, massive earthquakes and catastrophic wildfires. That future cost is not an if, but a when — or rather a sequence of whens made more frequent and severe by the climate crisis.

In research for the U.S. Federal Emergency Management Agency and others, my colleagues and I applied simple methods to design buildings to be stronger, stiffer, or above the flood plain than the U.S. building code currently requires. (Canada’s National Building Code is similar.) We found that society would initially pay about one per cent more for new construction, but avoid future losses many times greater, minimising society’s long-term ownership cost.

Engineers could have used these ideas long ago. If we had, Canada wouldn’t be losing over $2 billion annually to natural catastrophes, equivalent to the cost of four days of new construction.

Our losses grow nine per cent every year, like a credit card that gets charged more each month than is repaid. But unlike a credit card bill, nature demands an unpredictable, enormous payment any time it wants, from anywhere in the country. No Canadian community is immune.

Graphic showing the rate of increase of disaster losses compared to population growth.
Canada’s annual disaster losses have grown about nine per cent annually, 10 times faster than population growth. Author provided

We can fix the problem

Prime Minister Trudeau has committed to bold, fast action on climate change and its associated disasters, and better building codes can be a part of it. We could install sewer backflow valves in homes and workplaces, use non-combustible siding rather than vinyl in the wildland-urban interface (where the built environment mingles with nature) and install impact-resistant asphalt shingle roofs in hail country. Engineers have long lists of ready-made solutions both for new buildings and the ones we already have.

Building codes created those problems. They aim for safe and maximally affordable construction, and ignore long-term ownership cost. We build cheaply but not efficiently.

Three fatal tornadoes in 15 years convinced city officials in Moore, Okla., that the national building codes weren’t protecting them. So, they enacted an ordinance to make new buildings resistant to all but the most severe tornadoes.

Developers warned that the stricter requirements would drive up home prices and that development would dry up or move outside Moore. Neither thing happened. A few years after the ordinance passed, researchers found no impacts on home prices or development.

Other jurisdictions could do better too, just like Florida did after Hurricane Andrew in 1992. The state leapt ahead of U.S. building codes with its own stricter, more cost-effective code. The Insurance Institute for Business and Home Safety developed a voluntary standard, called “Fortified,” that reduces future losses and more than pays for itself in higher resale value.

Disaster-resilient buildings that also cost less

The climate crisis is forcing major energy-efficiency changes to the building code, offering a rare opportunity to fix our growing disaster liability and minimize long-term ownership cost. The update might include these three steps:

  • Enact a building code objective to minimize society’s total ownership cost of new buildings. The Canadian Commission on Building and Fire Codes could formalize the principle in the National Building Code of Canada.
  • Require code-change requests (proposals people make to the Canadian Commission on Building and Fire Codes for inclusion in the National Building Code) to be accompanied by estimates of added construction costs and benefits in terms of reduced energy use, future repair costs, improved health and life safety outcomes, and other economic effects whose monetary value can be reasonably estimated.
  • Limit the freedom of code committees to reject cost-effective code-change requests.

Such changes will eventually shrink Canada’s disaster credit card balance. While Canada rethinks energy efficiency, it can also tackle the false economy of least-first-cost construction. With slightly greater initial costs, our buildings will be better able to survive disasters and cost less to own in the long run.

With a wiser code, we can have better, safer, more efficient buildings for ourselves, our neighbours, our children and all future Canadians.

Keith Porter, Adjunct research professor, civil and environmental engineering, Western University

This article is republished from The Conversation under a Creative Commons license. Read the original article.